
Two RF amplifiers can both carry a 20 W rating and still answer different engineering requirements. One may specify saturated output power. Another may list output power without identifying the compression point. A buyer comparing only the wattage misses the information that determines whether either amplifier can reproduce the intended signal.
For an engineer evaluating a broadband RF power amplifier, the useful question is: how much output is available at the required frequency, with the required waveform, under the intended operating conditions?
A real specification comparison
Consider two CorelixRF products in the available datasheets. These cover different frequency bands, so they are examples of how to read specifications rather than interchangeable alternatives.
The CRF-PA-2000M18000M-20W lists:
- Frequency range: 2–18 GHz.
- Output power: 20 W, listed in the minimum column.
- Small-signal gain: 43 dB minimum.
- Maximum listed input power: 0 dBm.
- SMA-F input and output connectors.
- 28 V DC supply and an external heatsink requirement.
The CRF-PA-18G40G-20W electrical table lists:
- Frequency range: 18–40 GHz.
- Saturated output power, Psat: 20 W minimum.
- Small-signal gain: 43 dB minimum.
- Maximum listed input power: 0 dBm.
- 2.92 mm female input and WRD180 output.
The second table explicitly identifies saturation. The first does not identify its 20 W entry as P1dB or Psat. Neither document supplies a P1dB-versus-frequency curve. Consequently, neither listing establishes 20 W of linear output for a particular modulated waveform. That requires additional measurement information.

What gain and compression actually describe
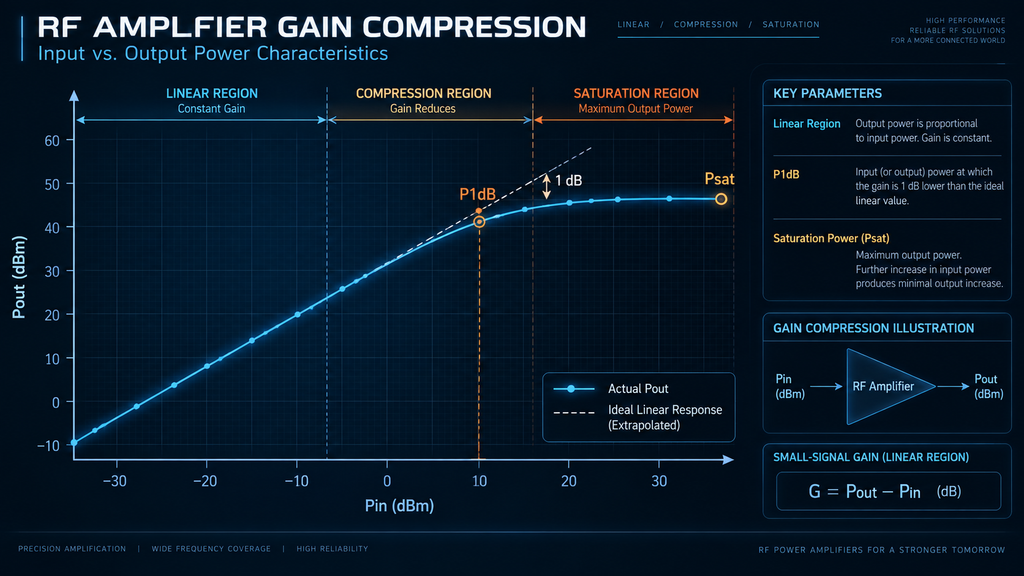
Small-signal gain describes amplification where the response is approximately linear. In that region:
Output power (dBm) ≈ input power (dBm) + gain (dB).
As drive increases, the measured output eventually falls below the linear extrapolation. At the 1 dB compression point, gain is 1 dB below its reference linear value. Input P1dB and output P1dB identify the input and output powers at that condition; they are different quantities. Keysight’s gain-compression documentation explains this measurement distinction.
Psat describes saturated output, where additional drive produces little useful output increase. It is not a substitute for a linearity specification. Nor is there a universal conversion from Psat to P1dB that can safely be applied to an undocumented product .
For example, 20 W is approximately 43 dBm. Subtracting a listed 43 dB small-signal gain gives a rough input estimate near 0 dBm. That arithmetic does not prove 20 W of linear output: actual gain can change with frequency, drive, temperature and compression. It also does not authorize exceeding the listed input limit to reach a desired output.
Let the application choose the measurement
A communications engineer working with a high-crest-factor signal needs to know whether signal peaks remain acceptable at the required average output. Error vector magnitude, adjacent-channel emissions and the actual waveform matter. A single-tone power rating cannot answer all of those questions. The required output backoff should come from measured performance against the system limits.
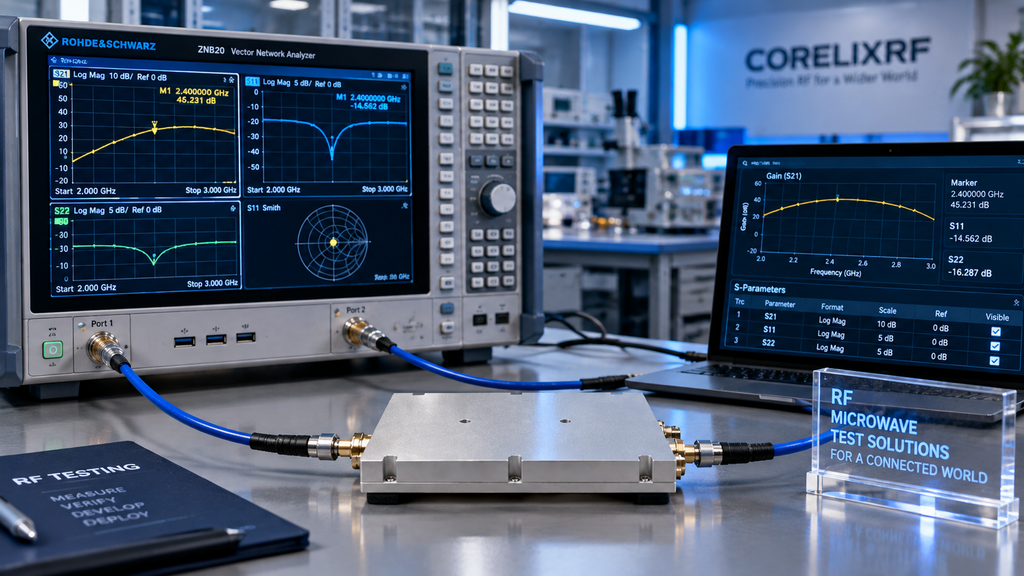
A microwave test laboratory may have a different objective: maintaining a specified level while sweeping frequency. Here, the weakest part of the required band can determine system capability. Ask for output and gain curves across the intended sweep, not just a favorable center-frequency measurement.
A radar engineer evaluating a pulsed RF power amplifier must distinguish peak power, pulse width, repetition rate and duty cycle. A CW-rated product does not automatically qualify for every pulse requirement, and a pulse-power figure does not establish continuous output capability.
Satellite communications, antenna measurements and scientific instrumentation introduce their own requirements for signal quality, bandwidth and interfaces. These are application-level considerations; frequency overlap alone does not qualify either example product for a complete system.
What reaches the load?
Power at the amplifier connector and power at the device under test are different reference planes. A cable, coupler, adapter or waveguide transition between them changes the delivered level.
As a hypothetical example, a matched path with 1 dB insertion loss would reduce 20 W at its input to approximately 15.9 W at its output. This is a path-loss calculation, not a measured result for either CorelixRF model. Mismatch and measurement uncertainty require separate consideration.
The difference becomes especially relevant when comparing a coaxial output with a waveguide output. The full measurement chain must have suitable frequency coverage, power handling and calibration. An adapter does not make the two configurations equivalent.
Build a comparison that supports a decision
When comparing amplifier specifications for a project, record the conditions beside each number. A useful comparison includes:
- The required frequency range and whether each value is minimum, typical or maximum.
- The output definition: rated output, output P1dB or Psat.
- The waveform and measurement bandwidth.
- Input drive and the reference plane used for measurement.
- Supply, temperature and cooling conditions.
- Frequency-dependent output, gain and relevant distortion results.
A missing entry is a question for engineering review, not a number to infer from a nearby specification. This keeps a product shortlist tied to the actual test or operating requirement.
For a CorelixRF selection review, provide the operating band, waveform, required power at the load and interconnection losses. Those inputs make it possible to identify which additional curves and measurements are needed before choosing a configuration.