For many RF engineers, receiving a cable test report feels like confronting an impenetrable wall of numbers. Misinterpreting this data doesn’t just waste time; it leads to the unnecessary replacement of functional cables or the catastrophic deployment of components that fail under high-power conditions. Interpreting VSWR and return loss is the specialized process of translating signal reflection ratios into a clear assessment of transmission line integrity and system efficiency. Mastering these metrics ensures your hardware remains protected and your measurement accuracy remains high.
What is the Primary Difference Between VSWR and Return Loss?
Interpreting VSWR and return loss starts with recognizing that both metrics describe the exact same physical phenomenon: signal reflection due to impedance mismatches. While VSWR provides a linear ratio of voltage standing waves, return loss offers a logarithmic power perspective in decibels.
How do the measurement units vary?
Units vary because VSWR is expressed as a ratio (e.g., 1.2:1), while return loss is measured in dB. Engineers often prefer one over the other depending on the precision required for the specific test environment.
Look:
A VSWR of 1.2:1 is mathematically equivalent to a return loss of roughly 20.8 dB.
- VSWR: Best for a quick visual of the voltage peaks.
- Return Loss: Best for identifying subtle power reflections.
- Consistency: Both should trend together in any valid test.
Key Takeaway
Understanding that these metrics are two sides of the same coin allows for more flexible data analysis across different report formats.
| Metric | Format | Focus |
|---|---|---|
| VSWR | Ratio | Voltage Peaks |
| Return Loss | Decibels (dB) | Power Ratios |
This fundamental relationship ensures that regardless of the reported unit, the underlying reflection behavior is clearly understood.
Why is Interpreting VSWR Data Critical for System Reliability?
Interpreting VSWR data is essential because high reflection levels create standing waves that generate excessive heat and stress on active components. If these standing waves are ignored, the resulting voltage peaks can physically damage sensitive transmitter stages or power amplifiers.
Does poor VSWR damage your hardware?
Hardware damage is a very real threat when reflected energy is high enough to exceed component tolerances. Properly analyzed data acts as a diagnostic shield for your entire laboratory signal chain.
The truth is:
Reflected power doesn’t just disappear; it turns into heat.
- Component Stress: Reflected energy strains transistors.
- Signal Integrity: Mismatches increase noise floors and distortion.
- Operational Life: Consistent low reflections extend equipment longevity.
Key Takeaway
Reliable data interpretation prevents hardware failures by identifying reflection levels that could jeopardize expensive RF systems.
| Condition | System Impact | Risk Level |
|---|---|---|
| Low VSWR | Maximum energy transfer | Low |
| High VSWR | Component heating/arcing | High |
Active monitoring of reflection trends is a standard requirement for maintaining high-frequency RF engineering capability.
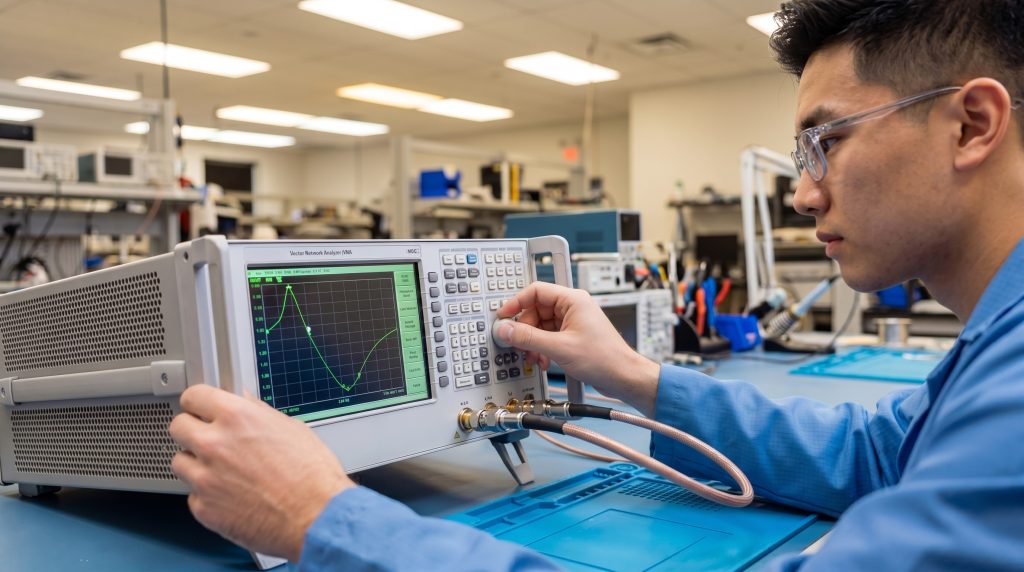
How Do You Read VSWR Ratios on a Standard Test Report?
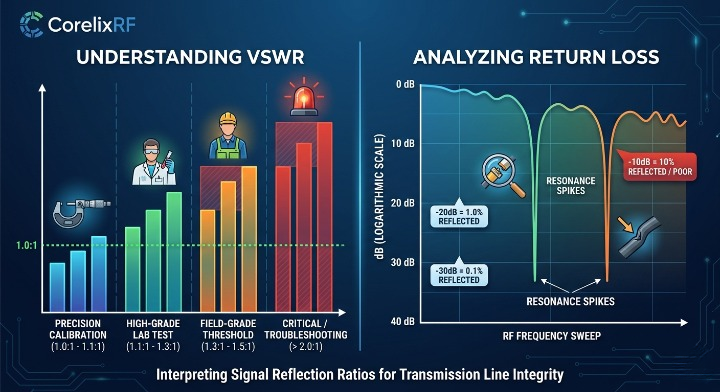
Interpreting VSWR involves looking for values as close to 1.0:1 as possible, which represents a perfectly matched system with zero reflections. In most practical B2B applications, any ratio below 1.5:1 is considered high-quality, though precision systems often demand lower limits.
What is considered a “good” ratio?
A good ratio depends heavily on the specific frequency and the sensitivity of the connected hardware. While 1.2:1 is excellent for general lab use, some high-power systems may tolerate up to 2.0:1 before requiring intervention.
Consider this:
The lower the number, the more energy reaches the load.
- 1.0:1 to 1.1:1: Precision calibration standard quality.
- 1.1:1 to 1.3:1: High-grade laboratory test cable performance.
- 1.3:1 to 1.5:1: Standard industrial and field-grade threshold.
Key Takeaway
Reading a report requires setting specific pass/fail limits based on the application rather than relying on a generic “one size fits all” number.
| VSWR Range | Performance Level | Typical Application |
|---|---|---|
| < 1.1:1 | Exceptional | Metrology/VNA Calibration |
| 1.1 – 1.5:1 | Acceptable | Standard RF Lab Testing |
| > 2.0:1 | Critical | Troubleshooting Required |
Accurate ratio assessment is the foundation of ensuring your standard RF power amplifier platforms operate at peak efficiency.
Which Factors Most Commonly Cause Poor VSWR Measurements?
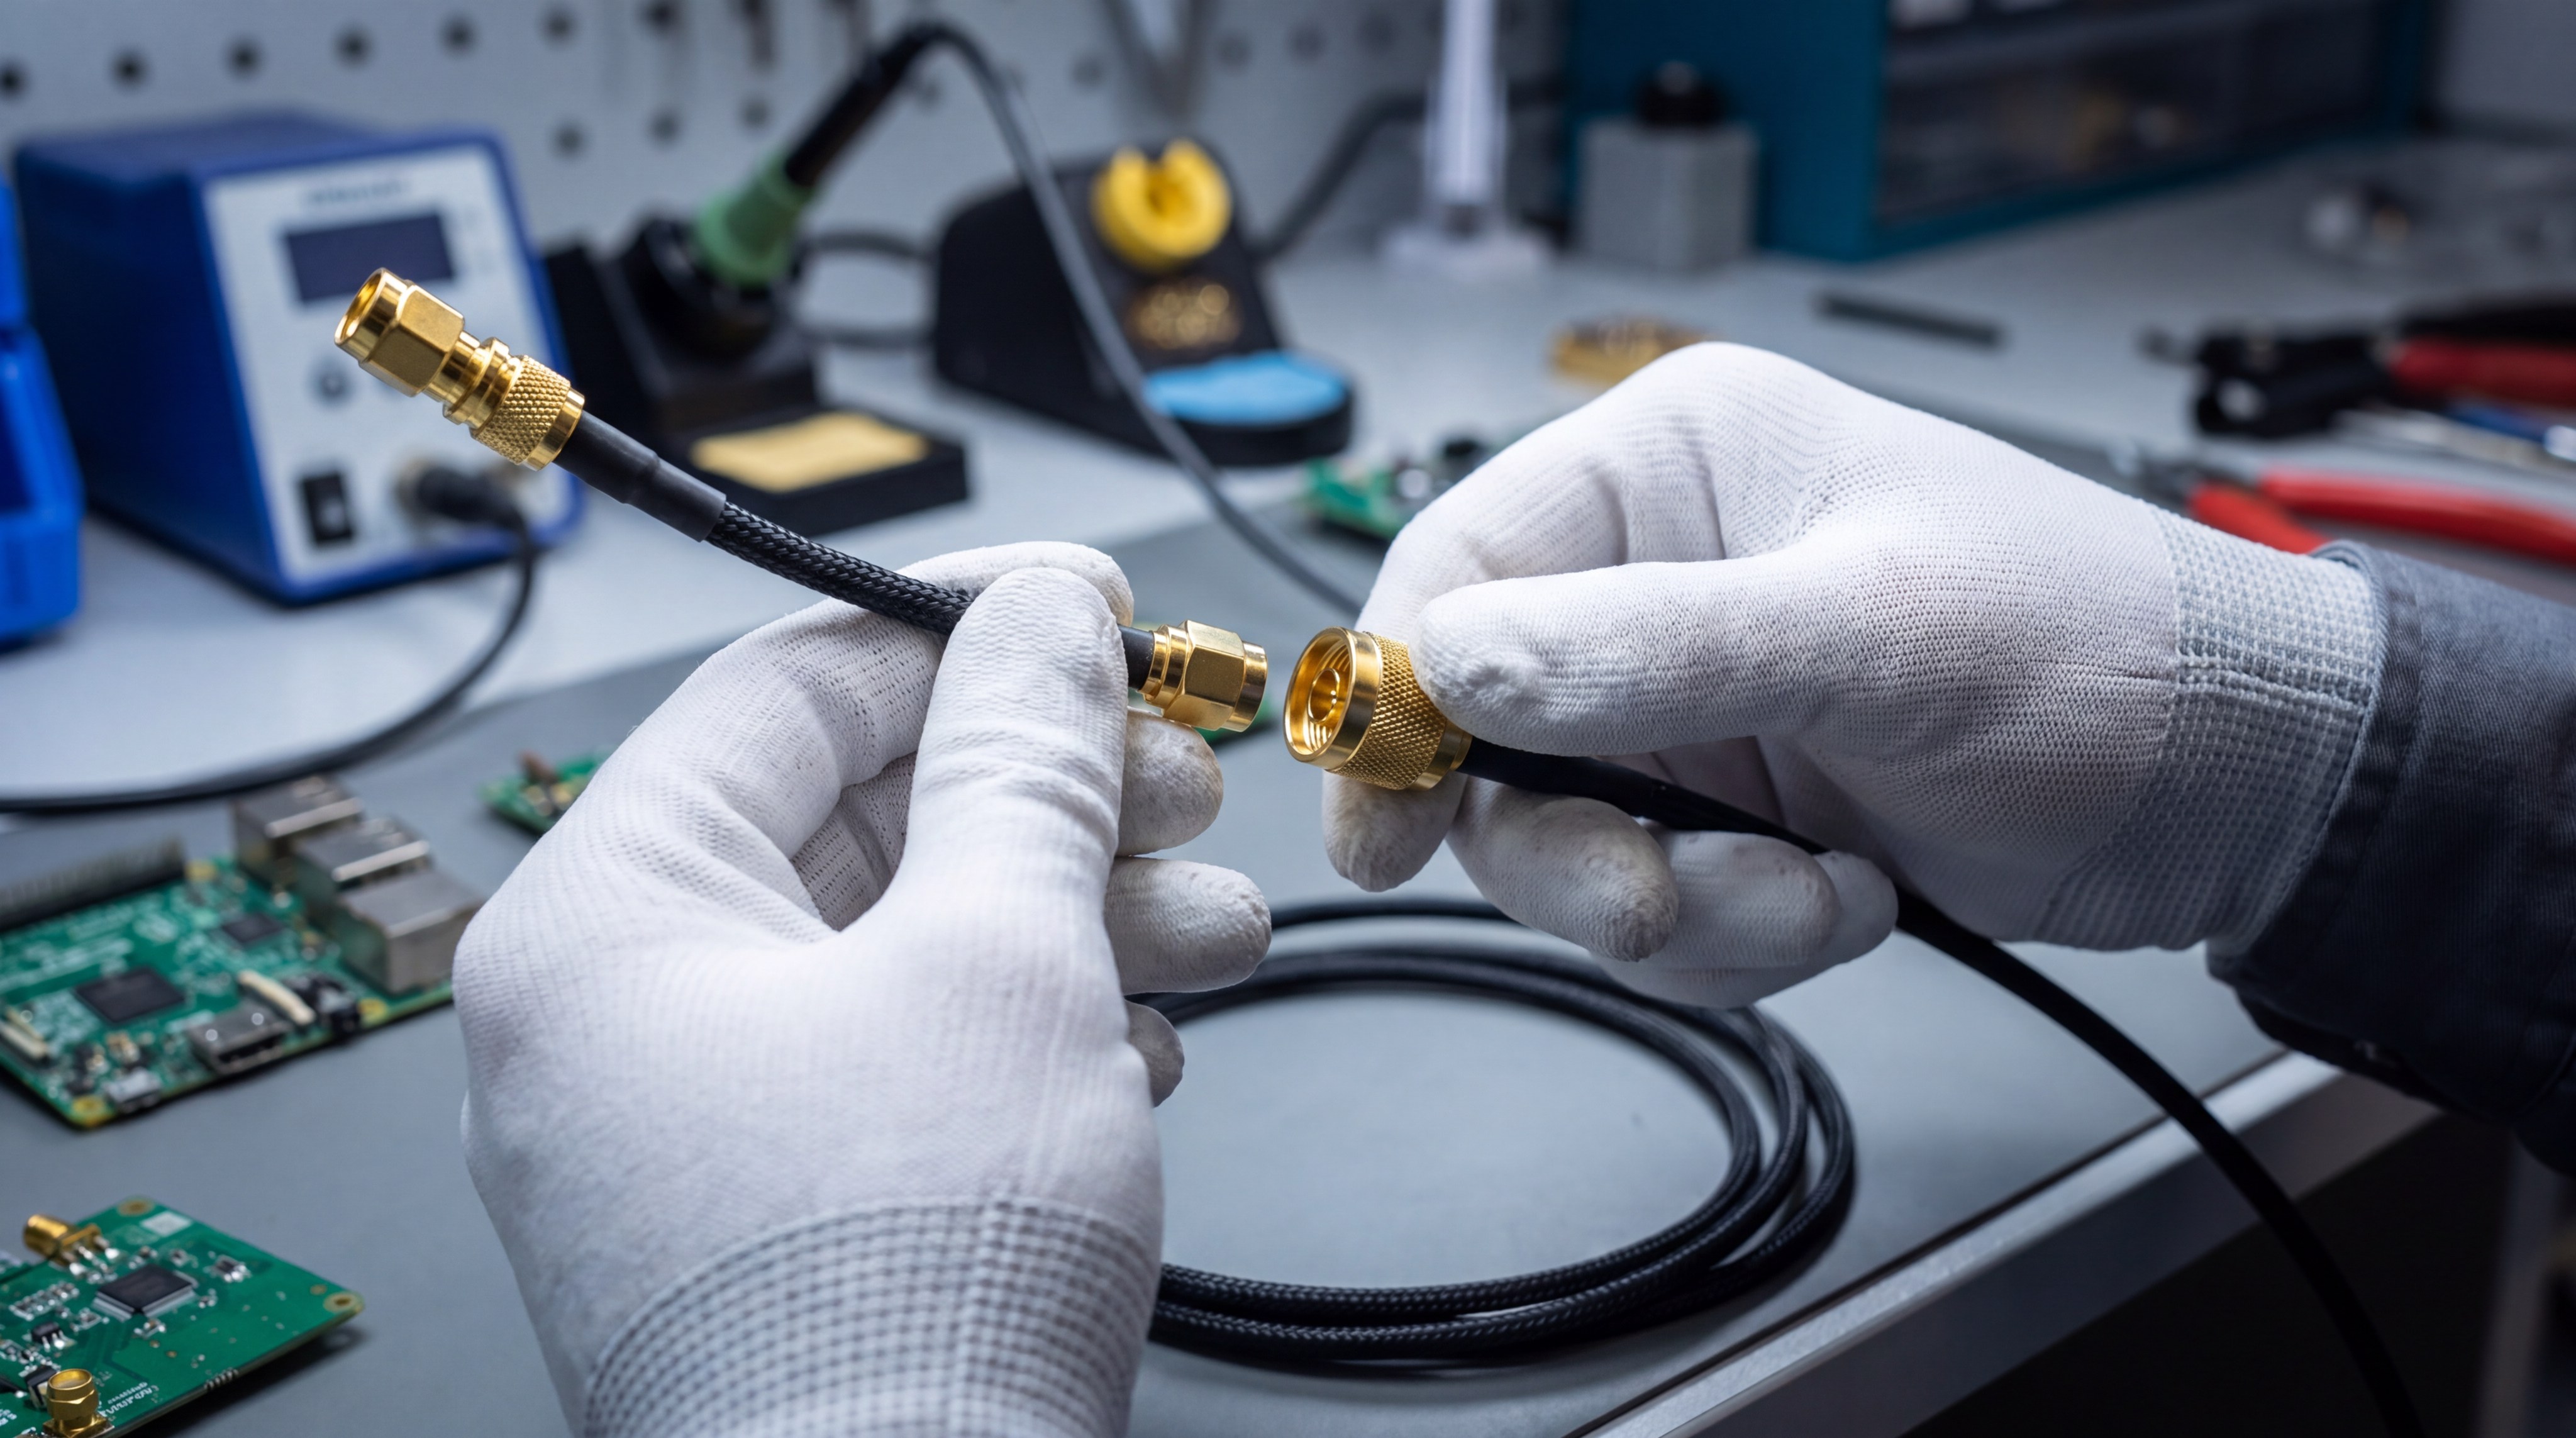
Interpreting VSWR spikes often leads back to mechanical issues such as damaged connectors, internal cable crushes, or contaminated mating surfaces. Even a single microscopic particle of debris inside an N-type or SMA interface can cause significant reflection anomalies.
Can connectors affect your test results?
Connectors are the most frequent source of impedance mismatches because they are the points of highest mechanical stress. If a connector is under-torqued or worn, the internal pin alignment will shift and disrupt the signal path.
Here is the catch:
A loose connector might look fine but fail the test.
- Pin Depth: Improperly seated pins cause capacitive mismatches.
- Debris: Dust or oil increases resistance and reflections.
- Torque: Inconsistent tightening alters the dielectric interface.
Key Takeaway
Most poor VSWR readings are mechanical in nature, highlighting the need for regular connector inspection and cleaning.
| Cause | Data Symptom | Resolution |
|---|---|---|
| Debris | Intermittent spikes | Clean with IPA |
| Worn Pin | High broadband VSWR | Component replacement |
Detailed mechanical inspection should always precede the diagnosis of an actual cable assembly failure.
How Does Return Loss Provide a More Detailed Performance View?
Interpreting VSWR through the lens of return loss is often easier for analysts because the logarithmic scale amplifies small differences. A change from 25 dB to 30 dB is visually significant on a plot, whereas the same shift is almost imperceptible on a linear VSWR scale.
Is higher return loss always better?
Higher return loss is always better because it signifies that more power is being “lost” to the load rather than returning to the source. A high dB value indicates a very small percentage of reflected power.
It gets better:
Return loss simplifies power budget calculations significantly.
- 20 dB: 1% of power is reflected.
- 30 dB: 0.1% of power is reflected.
- 10 dB: 10% of power is reflected.
Key Takeaway
Return loss is the superior metric for precision troubleshooting because it reveals subtle impedance variations that VSWR might mask.
| Return Loss | % Power Reflected | Quality |
|---|---|---|
| 30 dB | 0.10% | Precision |
| 20 dB | 1.00% | Good |
| 10 dB | 10.00% | Poor |
Using return loss data allows engineers to make more nuanced decisions when managing UHF RF amplifier capability across wide bandwidths.
Why Must You Analyze Data Across the Full Frequency Sweep?
Interpreting VSWR at a single point is dangerous because cables often exhibit frequency-specific defects. An assembly that performs perfectly at 1 GHz might show a massive reflection spike at 18 GHz due to a small physical imperfection in the dielectric.
Do spikes indicate localized failure?
Localized failures usually manifest as narrow “resonance” spikes on a frequency sweep plot. These anomalies often indicate exactly where a mechanical defect—like a kink in the cable—is physically located relative to the wavelength.
Don’t ignore the spikes:
One bad frequency can ruin a wideband signal.
- Narrow Spikes: Suggest localized physical damage or debris.
- Periodic Ripples: Indicate reflections between two specific points.
- Sloping Trends: Often signify broadband connector wear or aging.
Key Takeaway
A full frequency sweep is the only way to ensure a cable is truly operational across its entire rated bandwidth.
| Plot Pattern | Potential Cause | Action |
|---|---|---|
| Single Spike | Localized damage/kink | Inspect physical cable |
| Periodic Wave | Double reflection (both ends) | Check both connectors |
Comprehensive sweep analysis is a non-negotiable step for validating UHF RF test systems.
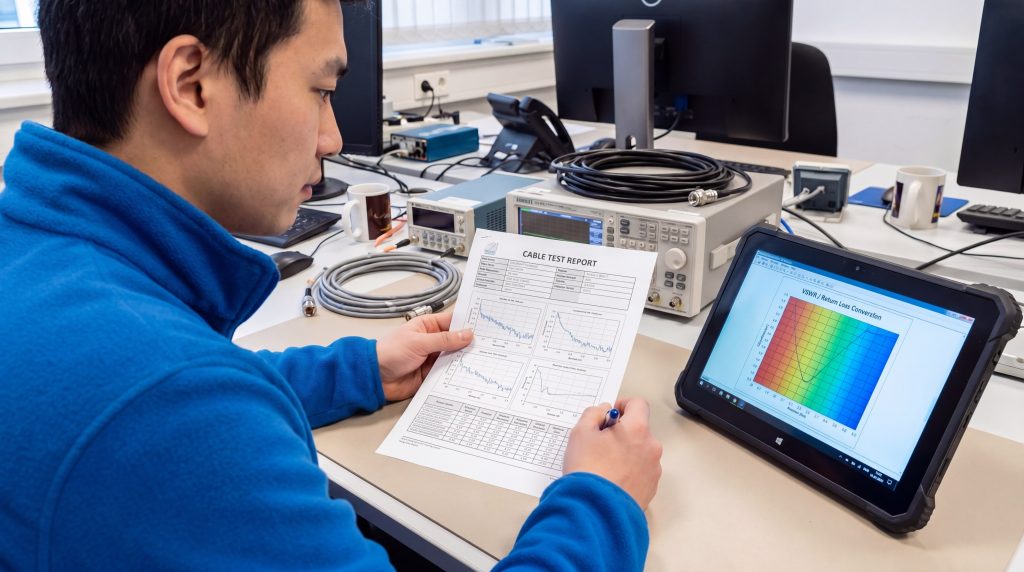
What Are the Essential Components of a Cable Test Report?
Interpreting VSWR requires more than just looking at the final number; you must also verify the test parameters used. A report must clearly state the start and stop frequencies, the number of data points, and the location of the calibration reference plane.
Why check the frequency range and resolution?
Resolution is critical because a low point count might “skip” over a narrow-band reflection spike, leading to a false pass. Always ensure the sweep resolution is high enough to capture the finest details of the transmission line.
Check the fine print:
The calibration date is just as important as the data.
- Sweep Points: More points mean higher diagnostic resolution.
- Calibration Plane: Defines where the measurement actually starts.
- Timestamp: Ensures the data reflects the current state of the cable.
Key Takeaway
Validating report parameters ensures the data you are interpreting is accurate, representative, and trustworthy.
| Report Element | Verification Step | Purpose |
|---|---|---|
| Resolution | Check sweep point count | Catches narrow defects |
| Cal Plane | Confirm VNA setup | Defines test boundaries |
Without proper test context, reflection data can be misleading or entirely inapplicable to your actual system environment.
Can You Cross-Reference VSWR and Return Loss for Accuracy?
Interpreting VSWR and return loss together provides a built-in “sanity check” for your test data. Since they are mathematically linked, a peak on the VSWR plot must perfectly align with a valley on the return loss plot at the exact same frequency.
Do discrepancies suggest measurement errors?
Measurement errors are likely if the trends between the two metrics do not mirror each other. If you see a high VSWR but an “excellent” return loss at the same frequency, your equipment likely requires recalibration.
Look for the match:
Nature doesn’t lie, but poorly calibrated VNAs can.
- Alignment: VSWR peaks should always match Return Loss dips.
- Proportionality: Changes in one must result in a specific change in the other.
- Validation: Cross-referencing identifies software or setup glitches.
Key Takeaway
Consistent trends between both metrics confirm the validity of the test and the health of the measurement equipment.
| VSWR Trend | Return Loss Trend | Conclusion |
|---|---|---|
| Rising | Falling | Valid reflection detected |
| Falling | Falling | Equipment error / Miscalibration |
This correlation check is a primary step in maintaining high-accuracy Laboratory RF Validation Systems.
How Should You Handle Cables That Show Marginal Test Results?
Interpreting VSWR data that sits right on the edge of your specification limits requires a conservative approach. Before discarding an expensive assembly, perform a “clean and re-test” cycle to ensure a simple contamination issue isn’t causing a false failure.
Is cleaning always the first step?
Cleaning is the most cost-effective first step because it often resolves intermittent reflection issues without requiring replacement. Use 99% isopropyl alcohol and specialized swabs to ensure the connector mating planes are pristine.
The best part?
Most “failed” cables just need a good cleaning.
- Swab Interfaces: Remove metallic shavings and dust.
- Retest: Perform the sweep again to see if spikes disappear.
- Inspect: Use a connector microscope to look for physical pitting.
Key Takeaway
Proactive maintenance often salvages marginal components, saving significant replacement costs over the life of the project.
| Test Result | Initial Action | Secondary Action |
|---|---|---|
| Marginal Fail | Clean and Retest | Torque check |
| Persistent Fail | Inspect for damage | Permanent retirement |
Always verify your maintenance results against your internal quality standards at CorelixRF.
How Does Historical Data Improve Long-Term Cable Management?
Interpreting VSWR trends over time—rather than as isolated events—allows for predictive maintenance of your RF infrastructure. By comparing current reports to baseline data from six months ago, you can identify a cable that is slowly degrading before it actually fails.
Is predictive maintenance possible with reflection data?
Predictive maintenance is entirely possible when you track the “aging curve” of your high-flex or high-use test leads. A steady, gradual increase in broadband reflection is a clear indicator that the dielectric or connector interface is reaching the end of its life.
The big picture:
Data history turns reactive repairs into proactive management.
- Trend Analysis: Identify wear patterns before they cause downtime.
- Inventory Control: Retire old stock based on performance, not age.
- Reliability: Ensure every test starts with a known-good signal path.
Key Takeaway
Historical trending transforms raw test data into a powerful tool for maintaining long-term system integrity and operational readiness.
| Data Shift | Likely Cause | Suggested Action |
|---|---|---|
| Gradual Rise | General wear/aging | Plan for replacement |
| Sudden Jump | Mechanical trauma | Immediate retirement |
Consistent data management is the hallmark of a world-class RF engineering team. To ensure your systems meet the highest industry standards, contact us today for expert guidance on RF testing and validation. We are committed to pushing the boundaries of precision and reliability in every signal we help you master.
Frequently Asked Questions
How do I convert VSWR to Return Loss quickly?
You can use the formula $RL = -20 \log((VSWR-1)/(VSWR+1))$ or a standard conversion table. Generally, a VSWR of 1.5:1 corresponds to a Return Loss of about 14 dB, which is a common threshold for many RF systems.
Can a high VSWR actually blow up my amplifier?
Yes, if the VSWR is high enough, the reflected energy creates massive voltage peaks that can exceed the breakdown voltage of the output transistors. This is why many high-power amplifiers include protective VSWR shutdown circuits to prevent permanent hardware destruction.
Why is my cable failing only at high frequencies?
High frequencies have shorter wavelengths, which makes them much more sensitive to small physical gaps or imperfections in the cable assembly. A tiny air gap in a connector that is invisible at 1 GHz can appear as a major impedance hurdle at 20 GHz.
Does Return Loss appear as a negative number on my VNA?
This depends on your instrument’s settings; many VNAs display the S11 parameter, which is reported as a negative dB value. In this context, -20 dB S11 is effectively the same as a 20 dB Return Loss.
How often should I re-test my laboratory cables?
You should re-test high-use cables at least once a month or before any critical measurement campaign. Regular validation ensures that wear and tear from repeated flexing or mating hasn’t compromised your measurement accuracy.