
A GaN vs LDMOS solid state power amplifier comparison often begins with a replacement that looks straightforward. The output rating fits, but supply, driver, and cooling interfaces need changes. A component choice can quickly become a system redesign.
Compare complete GaN and LDMOS candidates at the same frequency, waveform, usable output, and temperature. Check what each option would change in your platform before comparing cost. Choose the supported configuration that meets your fixed limits with acceptable integration and ownership costs.
Throughout this article, any CorelixRF technical-documentation support, application review, customization path, or test-data recommendation is subject to project review, the supplied product configuration, and the project’s requirements.
What must stay constant in a GaN versus LDMOS comparison?
Keep the comparison level and operating conditions consistent before using GaN or LDMOS performance figures to rank candidates. Device data, module measurements, and rack-system specifications describe different boundaries.
Define a common amplifier operating point
Write a short comparison brief that both suppliers can answer. Include the required frequency range, signal bandwidth, output reference plane, waveform, load, and temperature condition. Use it while reviewing RF amplifier product families so candidate discovery follows the application.
- Define average, peak, and usable output where relevant.
- State permitted distortion and processing conditions.
- Identify the required installation boundary.
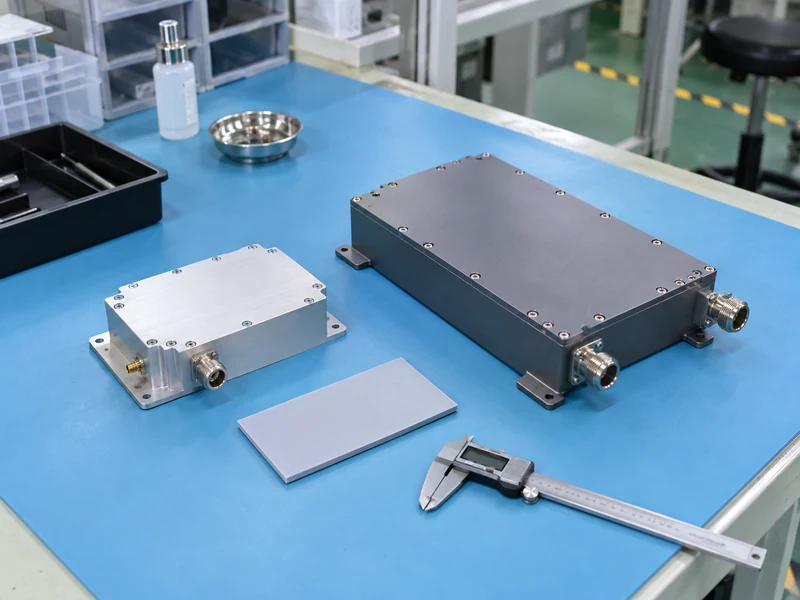
Compare complete products at the same boundary
Check what each measurement includes. A transistor efficiency figure does not describe a system containing drivers, conversion losses, control electronics, and cooling. Make the included functions explicit before interpreting a difference.
| Comparison level | Included scope | Evidence required |
|---|---|---|
| Device | Transistor test conditions | Applicable device data |
| Module | RF chain and stated auxiliaries | Module measurements |
| System | Delivered operating assembly | System-level results |
Different boundaries can create an apparent advantage without a corresponding project benefit. Key Takeaway: Align the equipment level and operating conditions before turning performance differences into purchasing decisions.
Which interfaces would a technology change affect?
A technology change can affect the supply, drive, control, protection, and mounting interfaces even when two amplifiers have similar output ratings. Check these constraints before investing in a detailed comparison.
Check supplies, bias control, and sequencing
Document the existing platform’s allowable changes. Some projects can replace the power supply and control software; others must retain a qualified assembly. Discuss the resulting scope through a custom RF development review when a catalog configuration cannot be evaluated independently of the platform.
- Record supply limits and startup behavior.
- Check available drive and required gain.
- Identify mechanical and control interfaces that must remain.
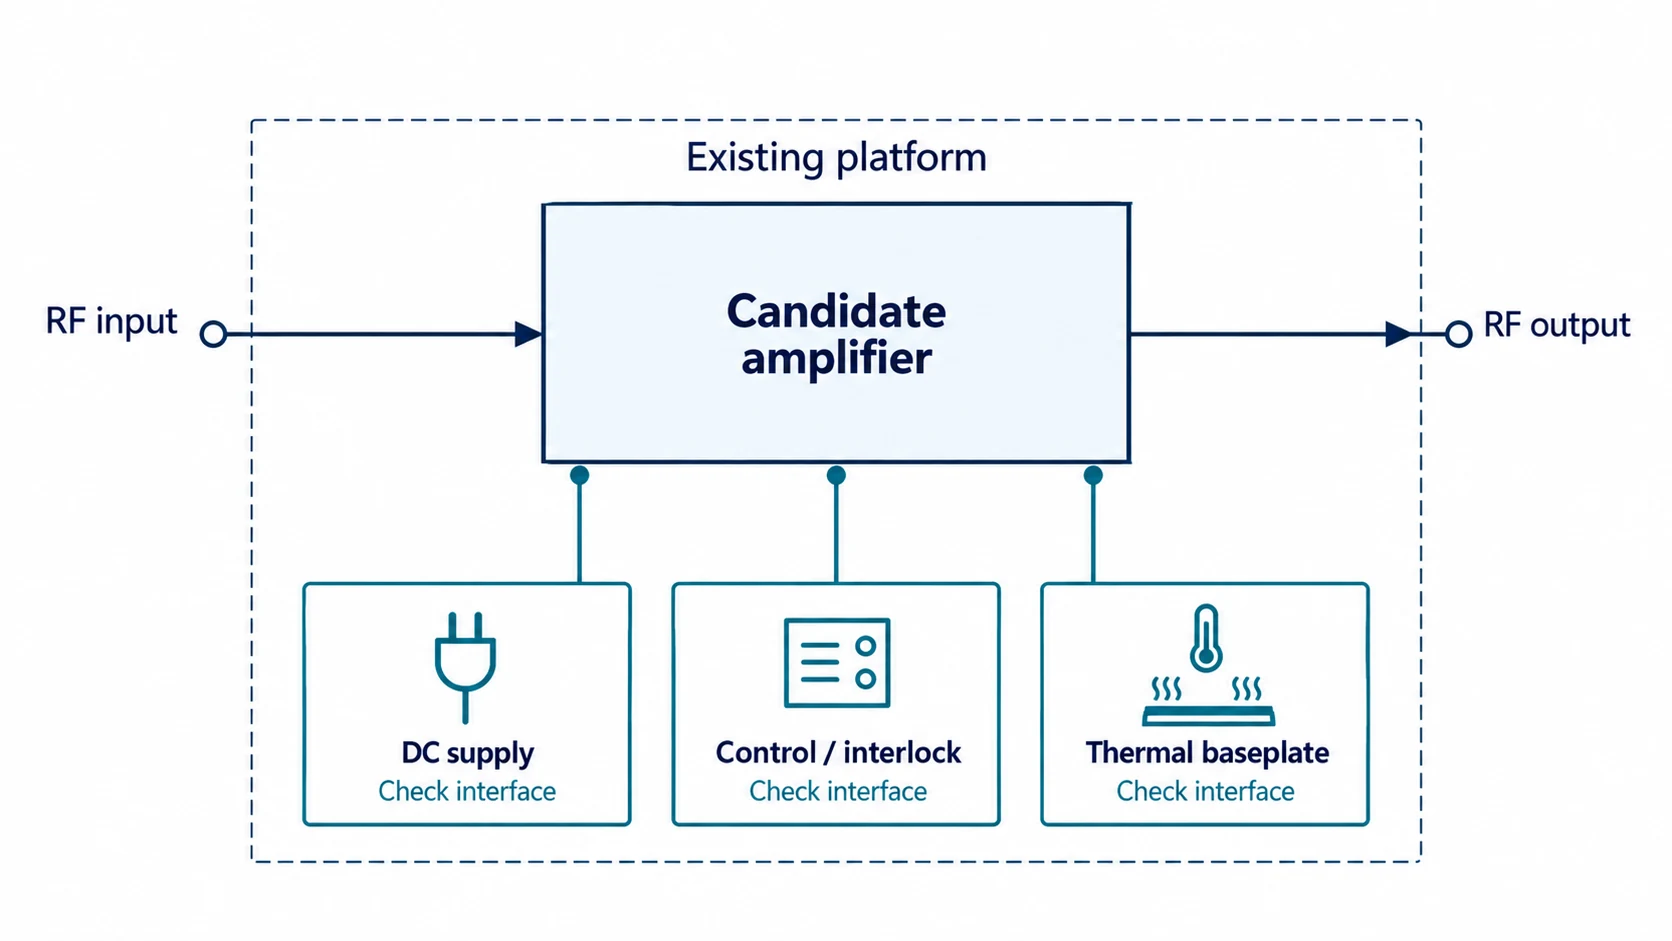
Compare mismatch tolerance and fault behavior
Trace each changed interface to a validation task. A different protection strategy can alter fault reporting, output reduction, or recovery. Ask for the proposed module’s behavior rather than assigning ruggedness from its semiconductor type.
| Interface | Possible change | Review owner |
|---|---|---|
| Supply and bias | Limits or sequencing | Electrical engineering |
| RF drive | Input range or gain | RF engineering |
| Protection | Fault and recovery behavior | System integration |
The interface review may expand the scope beyond the amplifier itself. Key Takeaway: List required platform changes and their owners before comparing acquisition prices.
How do frequency and bandwidth shape the choice?
Frequency and bandwidth shape the candidate search, but qualification still depends on measured performance from the proposed amplifier. A semiconductor name does not establish a universal changeover frequency.
Review device capability and circuit implementation
GaN and LDMOS offer different device design possibilities, while matching, packaging, bias, and stage architecture determine the finished result. A published technology comparison also examines the linearization work associated with particular amplifiers; its test-specific findings should not be generalized to every product.
- Identify continuous coverage and discrete operating bands.
- State the bandwidth of the actual signal.
- Request output and response data across required frequencies.
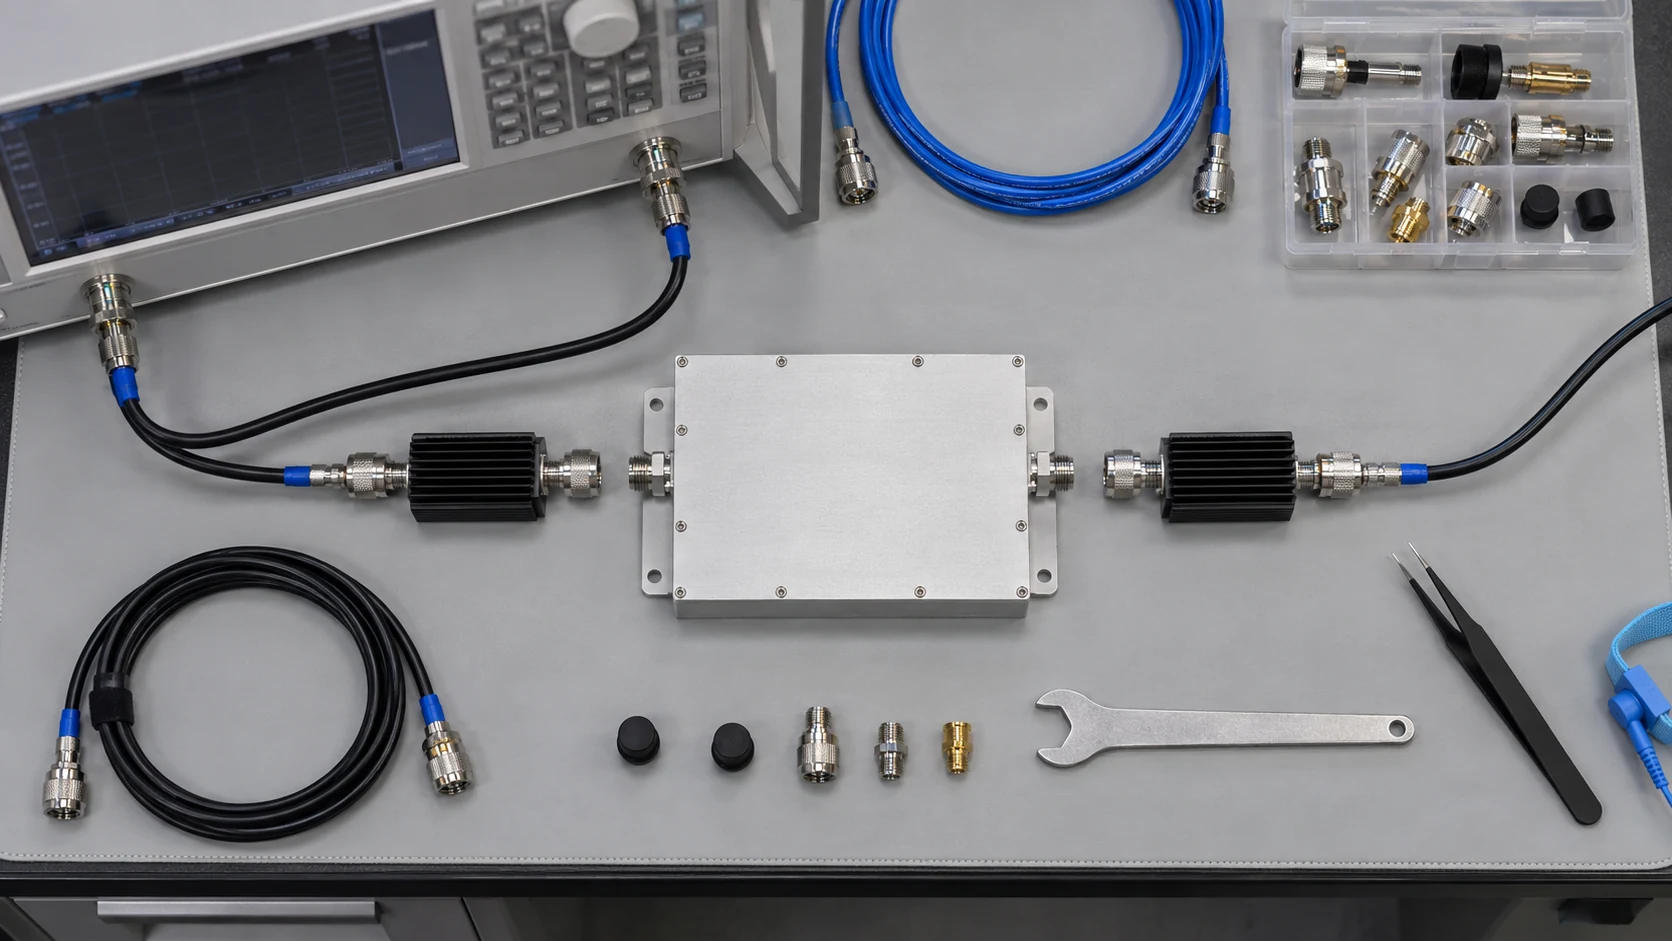
Check candidate coverage with measured data
Ask for the frequencies your system will use. If the project reaches into millimeter-wave amplifier ranges, confirm both the RF interfaces and usable output at those frequencies. A family-level range cannot qualify a specific configuration.
| Requirement | Candidate evidence | Unresolved issue |
|---|---|---|
| Continuous coverage | Full-range response | Untested intervals |
| Discrete bands | Results at required points | Missing band data |
| Signal bandwidth | Relevant waveform test | Coverage alone insufficient |
A gap at a required frequency can outweigh performance elsewhere. Key Takeaway: Select candidates from supported frequency and waveform conditions, keeping missing operating points visible.
What determines linearity in the finished amplifier?
Finished-amplifier linearity depends on the circuit and operating conditions, including bias, output backoff, and any linearization used. Compare distortion with equivalent signals and processing settings.
Review circuit architecture and operating conditions
Record whether digital predistortion, feedback, or another correction technique was active during measurement. Two results can both be valid yet describe different system implementations. Match the output level and thermal state as well as the signal format.
- Use the same modulation and signal bandwidth.
- Specify the required quality metric and limit.
- Record the linearization state and measurement settings.
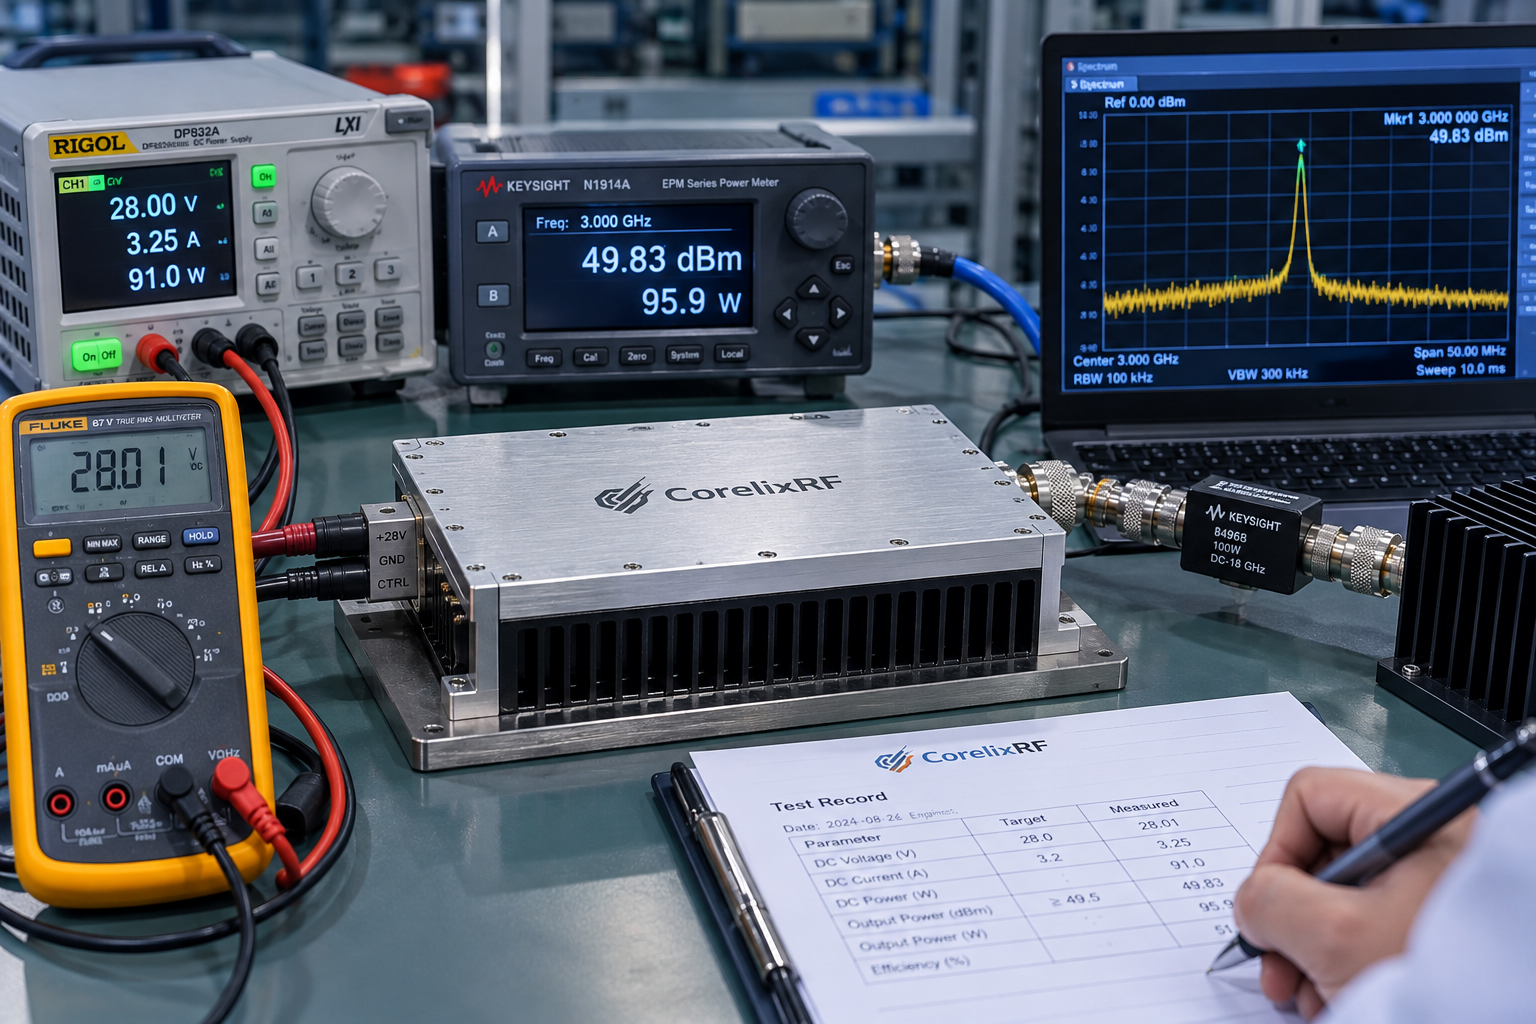
Request application-relevant distortion results
Compare the output that satisfies your quality limit. A candidate with a higher saturated rating may need a different operating backoff. Ask for evidence at the intended working point, including whether the claimed quality depends on processing your system can provide.
| Condition | Why align it | Buyer check |
|---|---|---|
| Waveform | Changes distortion behavior | Same test signal |
| Output level | Changes compression | Same usable-power target |
| Linearization | Changes complete-system result | Same included functions |
An unmatched processing condition changes what is being purchased and integrated. Key Takeaway: Compare linearity at the required usable output with the same signal and correction conditions.
Which technology delivers the required usable power?
The suitable candidate is the one that meets the output requirement while retaining the required signal quality and operating limits. Verify this at the conditions that constrain your project.
Separate compression, saturation, and rated output
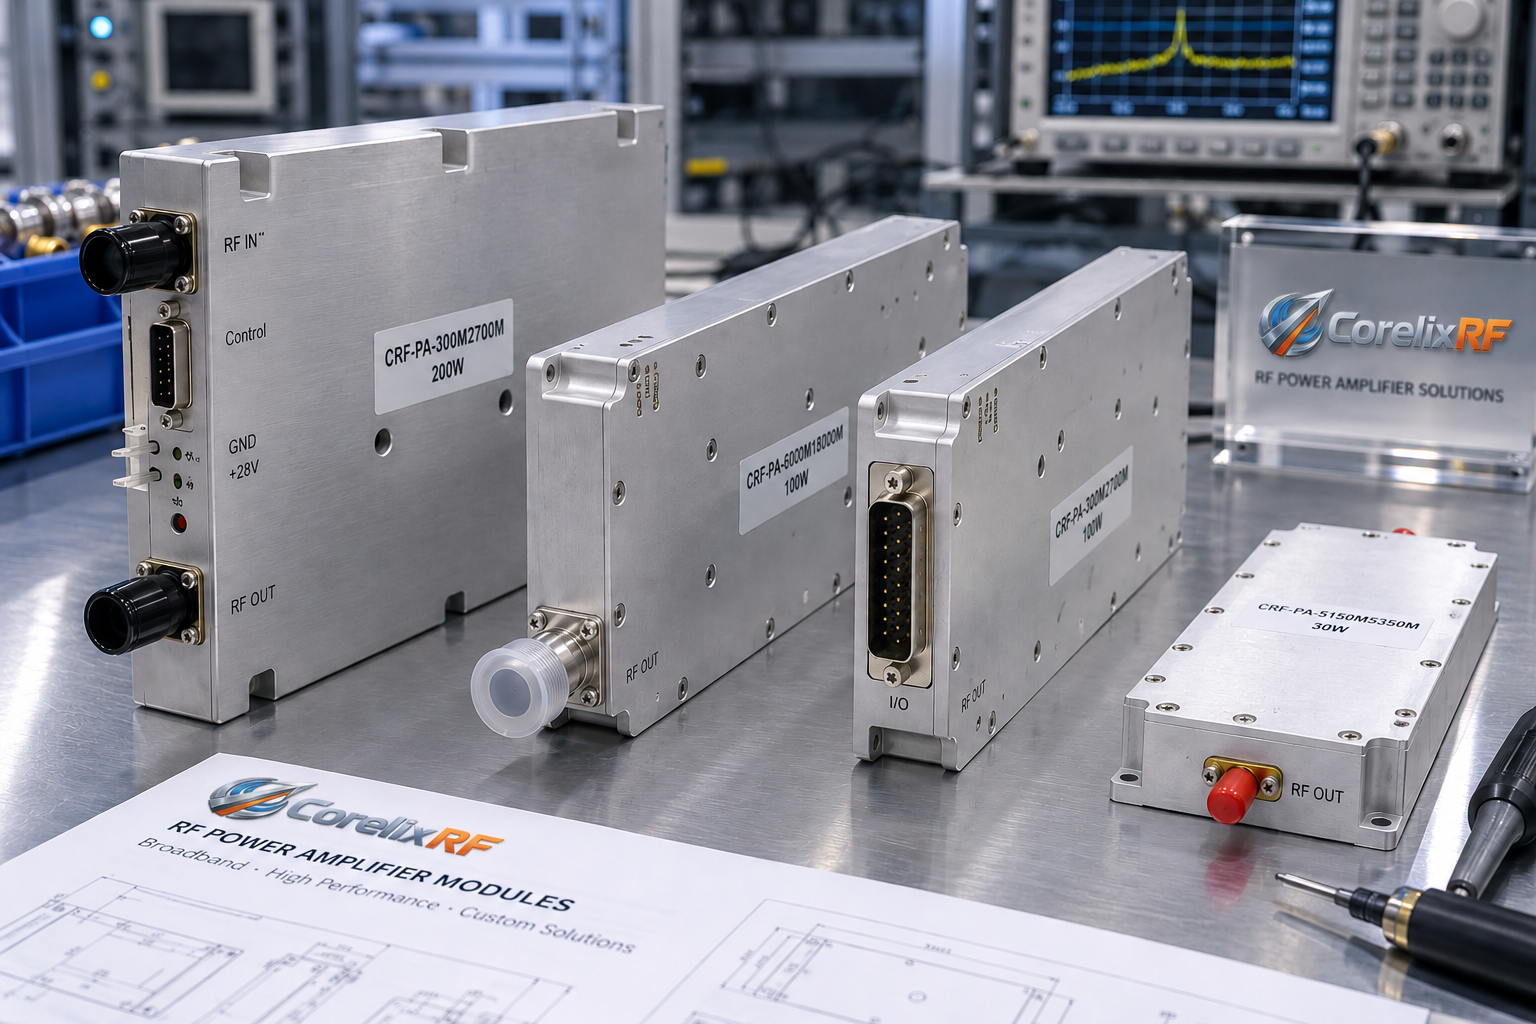
Record the exact definition attached to each wattage. P1dB describes a compression measurement, while an application may impose a different distortion limit. The output-power selection pages can narrow the search, but supporting data must establish the required working output.
- Distinguish typical values from guaranteed limits.
- State the output measurement plane.
- Attach waveform, frequency, and temperature conditions.
Review output across frequency and temperature
Keep the limiting condition in the comparison. Request the data needed to judge band edges and relevant thermal states. Where evidence is missing, ask for clarification or testing before treating the requirement as satisfied.
| Output claim | Condition to identify | Qualification use |
|---|---|---|
| Typical power | Sample and setup | Initial comparison |
| Guaranteed power | Stated operating envelope | Requirement assessment |
| Linear output | Defined quality criterion | Application suitability |
Changing the power definition can reverse an apparent ranking. Key Takeaway: Put a condition-specific usable-output requirement into the RFQ and compare both candidates against it.
How does each candidate affect thermal integration?
Thermal integration depends on total dissipation, heat concentration, mounting, and the allowed temperatures. A smaller amplifier is not automatically easier to cool.
Compare dissipated heat and temperature limits
Define the electrical and physical boundary before estimating heat. Include the appropriate RF input, RF output, and electrical input terms, and keep external auxiliaries separate. Record whether temperature limits refer to ambient air, a case, a baseplate, or a junction estimate.
- Specify the installed cooling condition.
- Identify the temperature reference and measurement method.
- Include sustained and changing-load operation.
Review cooling and mounting requirements
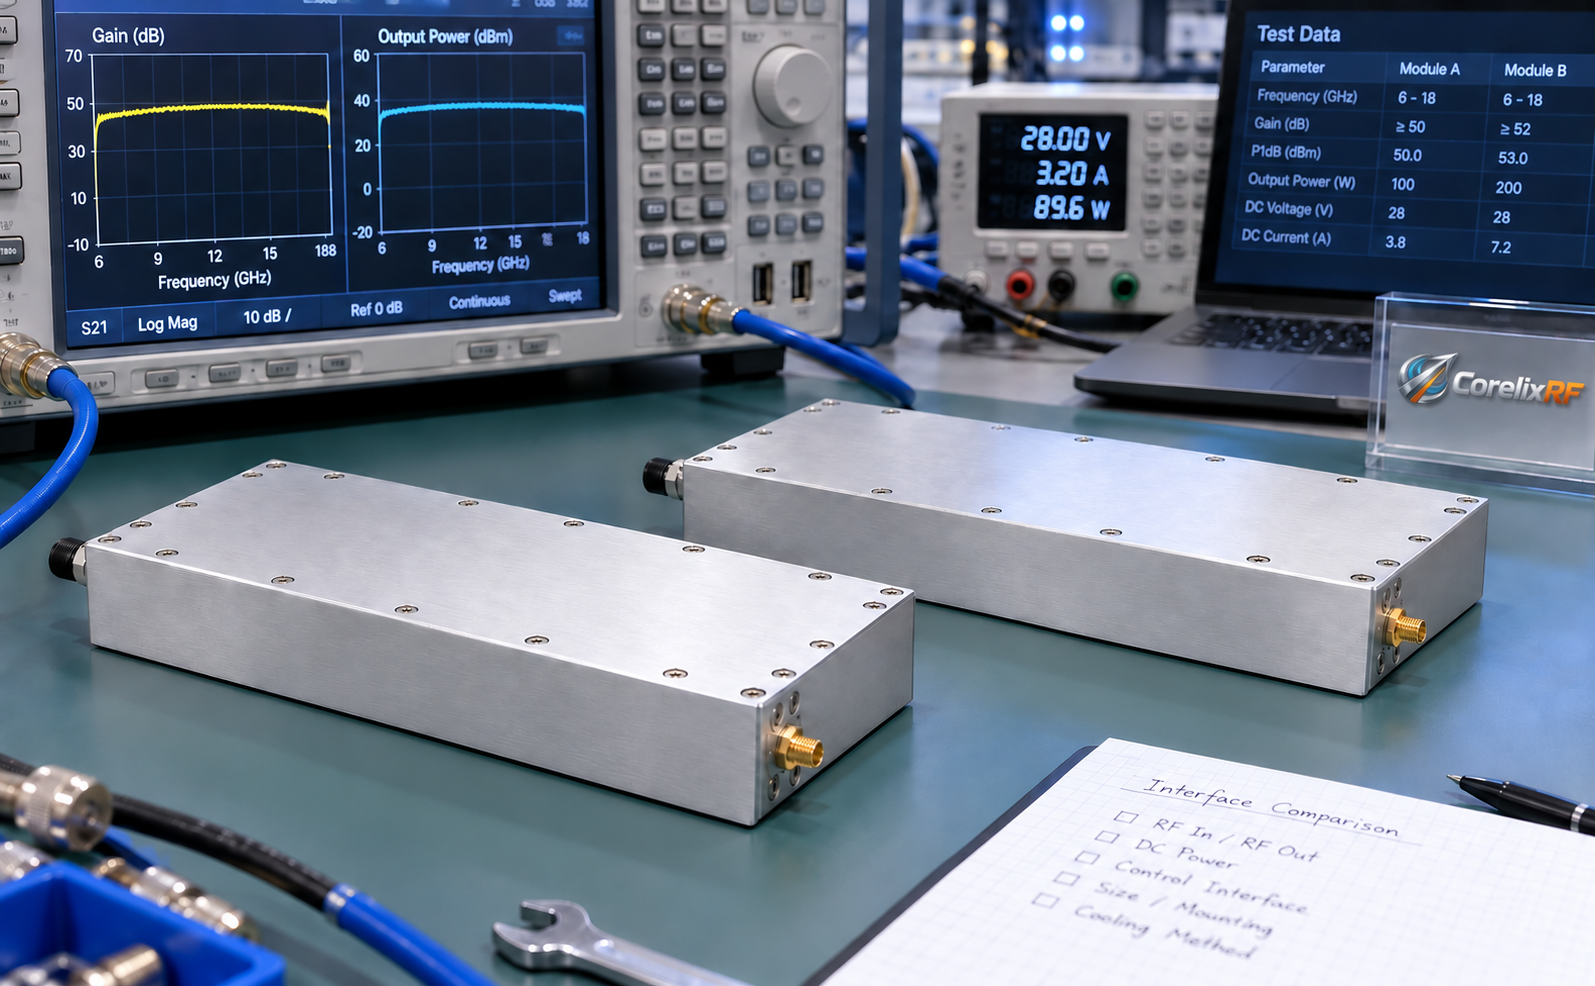
Follow the heat through the proposed installation. Review amplifier cooling integration with the actual mounting and interface materials. Total dissipated power alone cannot establish the local temperature at a device.
| Thermal question | Input required | Evidence |
|---|---|---|
| Total heat | Consistent power boundary | Operating measurements |
| Local temperature | Heat path and reference point | Applicable thermal data |
| Installed operation | Mounting and cooling conditions | Configuration test |
Lower total dissipation and lower local temperature are separate findings. Key Takeaway: Request thermal evidence for the intended installation instead of judging cooling needs from package size.
How should efficiency be compared under power backoff?
Compare efficiency at the output levels and operating states your system will use, with a consistent electrical boundary. A peak efficiency value may describe only a small part of the duty profile.
Distinguish device efficiency from system efficiency
Drain efficiency, power-added efficiency, and system input-to-output efficiency use different definitions. Power-added efficiency accounts for RF input power; a complete-system figure can include functions beyond the RF output stage. State the metric before comparing percentages.
- Identify which electrical loads are included.
- Record RF input and output reference planes.
- Use corresponding frequency and thermal conditions.
Evaluate efficiency with the actual signal
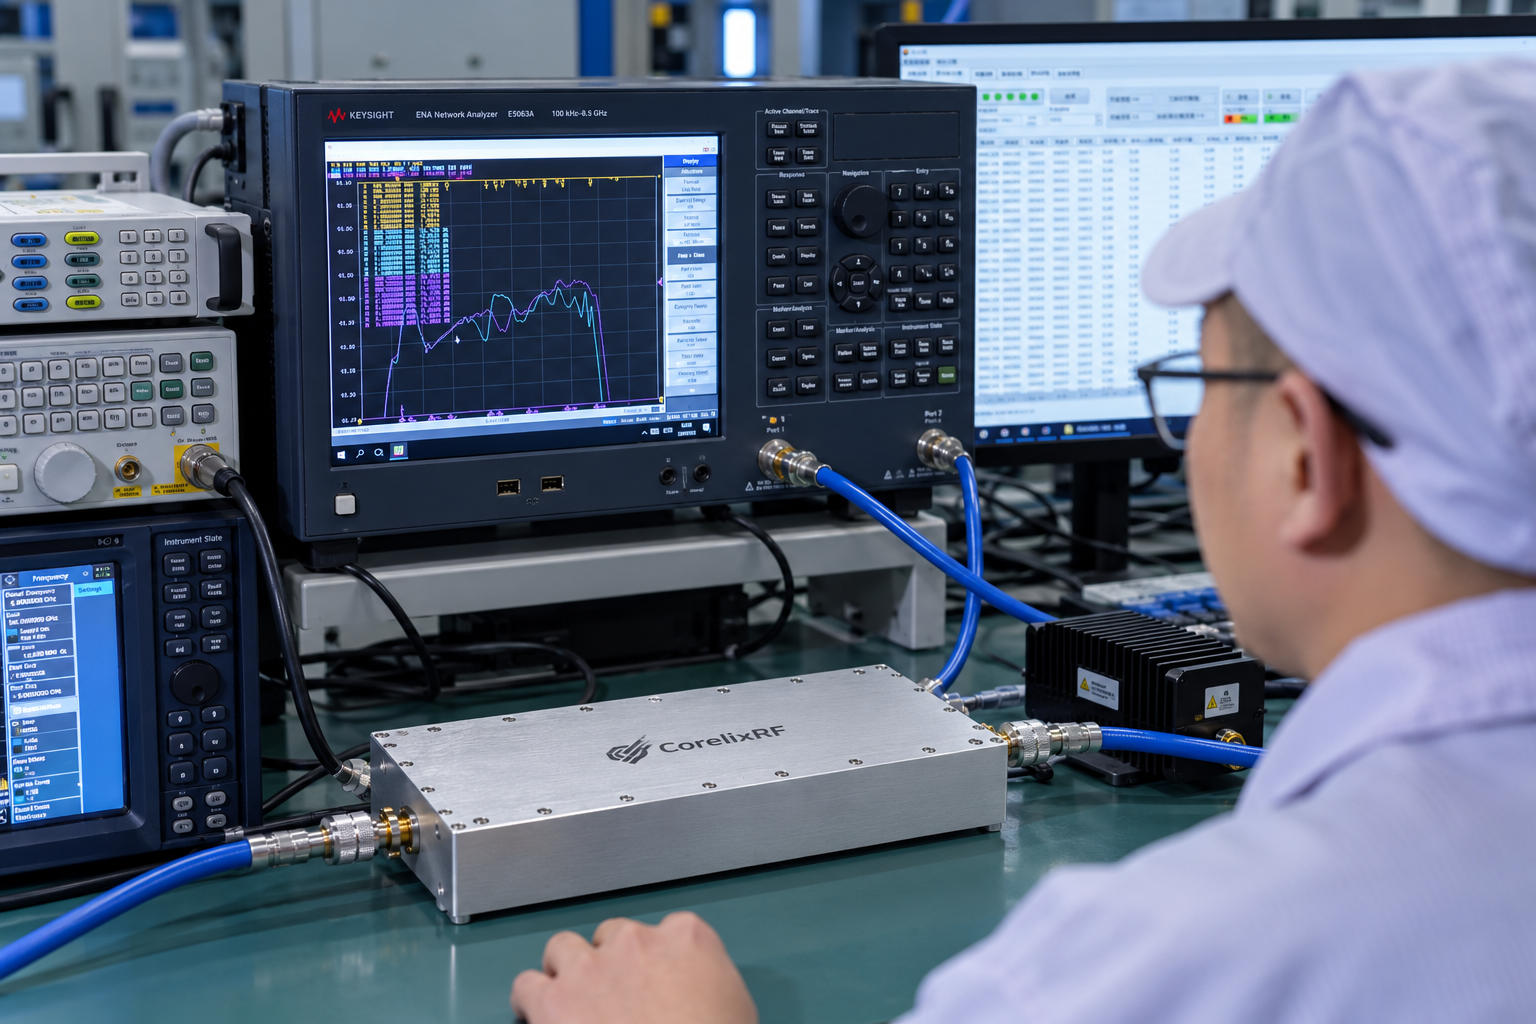
Move the comparison to normal operating output. Request RF amplifier measurements at the required backoff and waveform. Include standby or idle consumption if those states materially affect the application.
| Operating state | Data needed | Decision supported |
|---|---|---|
| Normal output | Input and usable RF output | Operating energy |
| Peak demand | Applicable efficiency and limits | Supply capability |
| Idle or standby | Included auxiliary consumption | Duty-profile estimate |
The more relevant efficiency figure may be away from full output. Key Takeaway: Use the actual operating profile to compare energy consumption and cooling implications.
How should lifecycle cost and supply risk be reviewed?
Review the full acquisition and support scope using current product-specific information. Semiconductor category alone does not establish price, availability, or lifecycle risk.
Include engineering, cooling, and qualification effort
Compare the same deliverable: amplifier, supporting hardware, integration work, testing, and documentation. Retaining an established platform may save work, but list the items that can actually be reused and the checks still required.
- Separate hardware price from engineering effort.
- Include installation and verification work.
- Identify recurring energy and service inputs.
Check product continuity and replacement constraints
Ask what happens when the supplied configuration changes. Agree the delivery documentation and change information needed to track revisions. Request current quotations and lifecycle statements for the named products instead of relying on historical material-cost assumptions.
| Cost or risk | Required input | Treatment |
|---|---|---|
| Platform reuse | Confirmed retained items | Count supported savings |
| Requalification | Defined change scope | Include engineering work |
| Supply continuity | Current product information | Record remaining uncertainty |
Unpriced redesign work can matter more than a small hardware-price difference. Key Takeaway: Compare complete project scope and current supply evidence before declaring one route less expensive or lower risk.
Which trade-offs favor each candidate in your project?
The candidate that clears every mandatory requirement deserves further consideration; preferences can then distinguish the remaining options. Keep unresolved hard requirements outside an overall score.
Build a condition-based decision matrix
Use a compact matrix with your requirement, the evidence for each candidate, and the next action. Avoid awarding points for a technology label. A missing required frequency, incompatible interface, or unverified output condition should remain visible.
- Mark mandatory limits and negotiable preferences.
- Record evidence dates and applicable configurations.
- Assign an owner to unresolved comparisons.
Flag conditions that need a prototype test
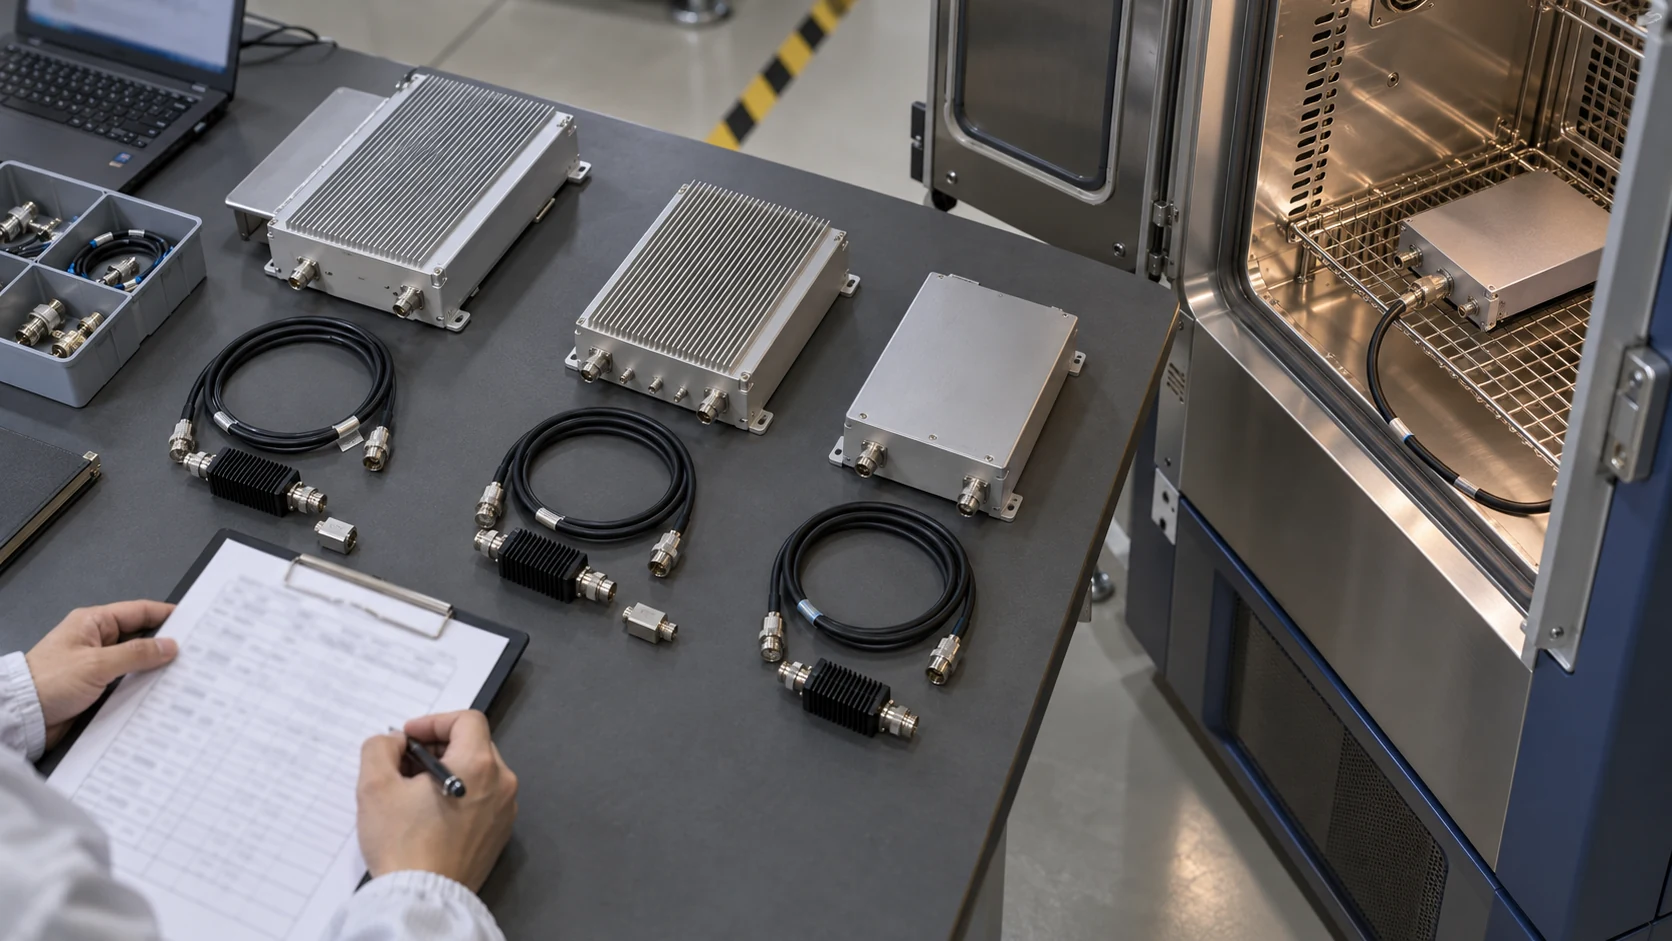
Separate a plausible candidate from a qualified one. Turn decisive gaps into a common test plan and carry them into the RFQ requirements checklist. Test where the result can change the decision.
| Evidence status | Interpretation | Next action |
|---|---|---|
| Meets common requirement | Supported candidate | Compare remaining trade-offs |
| Different test conditions | Comparison incomplete | Normalize or retest |
| Missing mandatory evidence | Qualification open | Request evidence before approval |
A favorable total score cannot resolve a failed hard requirement. Key Takeaway: Let verified requirements determine the shortlist, then use focused tests to resolve meaningful differences.
What should you request before choosing a technology?
Request a configuration-specific response to the same operating brief before choosing between GaN and LDMOS. Include both performance requirements and the platform changes you can accept.
Shortlist supported configurations
Retain the candidates with a documented route to the required output, signal quality, interfaces, and thermal operation. Where neither option has sufficient evidence, identify the measurement or engineering review needed next.
Submit a matched-condition evaluation brief
CorelixRF provides RF amplifier product information and an engineering contact route. Send the operating band, waveform, usable-output target, cooling limits, and retained interfaces when you contact us. Ask which candidate configuration and records address the complete brief.
We support decisions based on comparable conditions and verifiable results, with remaining questions stated clearly.
Key Takeaway: Submit the application and interface constraints together so the next review can establish a supported technology route.
Can I replace an LDMOS module with GaN without changing the system?
Only if the proposed configuration meets the existing RF, electrical, control, mechanical, and thermal requirements. Similar output power does not establish interchangeability.
How do I know if two efficiency figures are comparable?
Check the efficiency definition, included electrical loads, RF reference planes, waveform, output, frequency, and thermal state. Resolve mismatches before ranking them.
What’s the best way to compare linearity with DPD enabled?
Use equivalent signals and quality limits, and define whether both systems include DPD. Account for its processing and integration requirements.
Can I select a technology from saturated output power alone?
No. Verify the usable output under the signal-quality, load, frequency, and temperature conditions your application requires.
How do I know which differences need a prototype test?
Test unresolved conditions that could change acceptance or integration. A shared setup is particularly useful where supplier measurements use different operating conditions.