
When accepting RF power amplifiers, the procurement and Quality Assurance (QA) departments of many communications, radar, and electronic warfare system integrators often only verify the nominal values on the datasheet. However, the engineering reality in the field is often brutal: after equipment integration, issues like severe power drop-offs in high-temperature environments, amplifier burnout due to antenna impedance mismatch, or abnormal spurious emissions interfering with the entire receiving chain frequently occur, ultimately leading to project acceptance failure. What follows is a lengthy troubleshooting cycle and a buck-passing after-sales process.
In the field of RF hardware manufacturing, a datasheet is merely the supplier’s initial promise. The actual test report, based on physical mechanisms and captured by laboratory instruments, is the only Engineering Truth. To fundamentally eliminate the risk of false parameters and ensure the smooth passing of FAT/SAT (Factory/Site Acceptance Testing), procurement and QA teams must require RF suppliers to provide detailed test evidence. Below are the 10 core test questions and corresponding curves that must be reviewed when accepting an RF power amplifier.
1. Frequency Response Curve: Why does the band-edge power of broadband amplifiers always fail to meet standards?
- Engineering Mechanism: Achieving perfect impedance matching across an extremely wide frequency band is a physics challenge. The “maximum power” claimed by many suppliers is often just a peak value at a specific center frequency point.
- Which Curve to Review: You must review the full-band output power vs. frequency curve (Pout vs. Frequency).
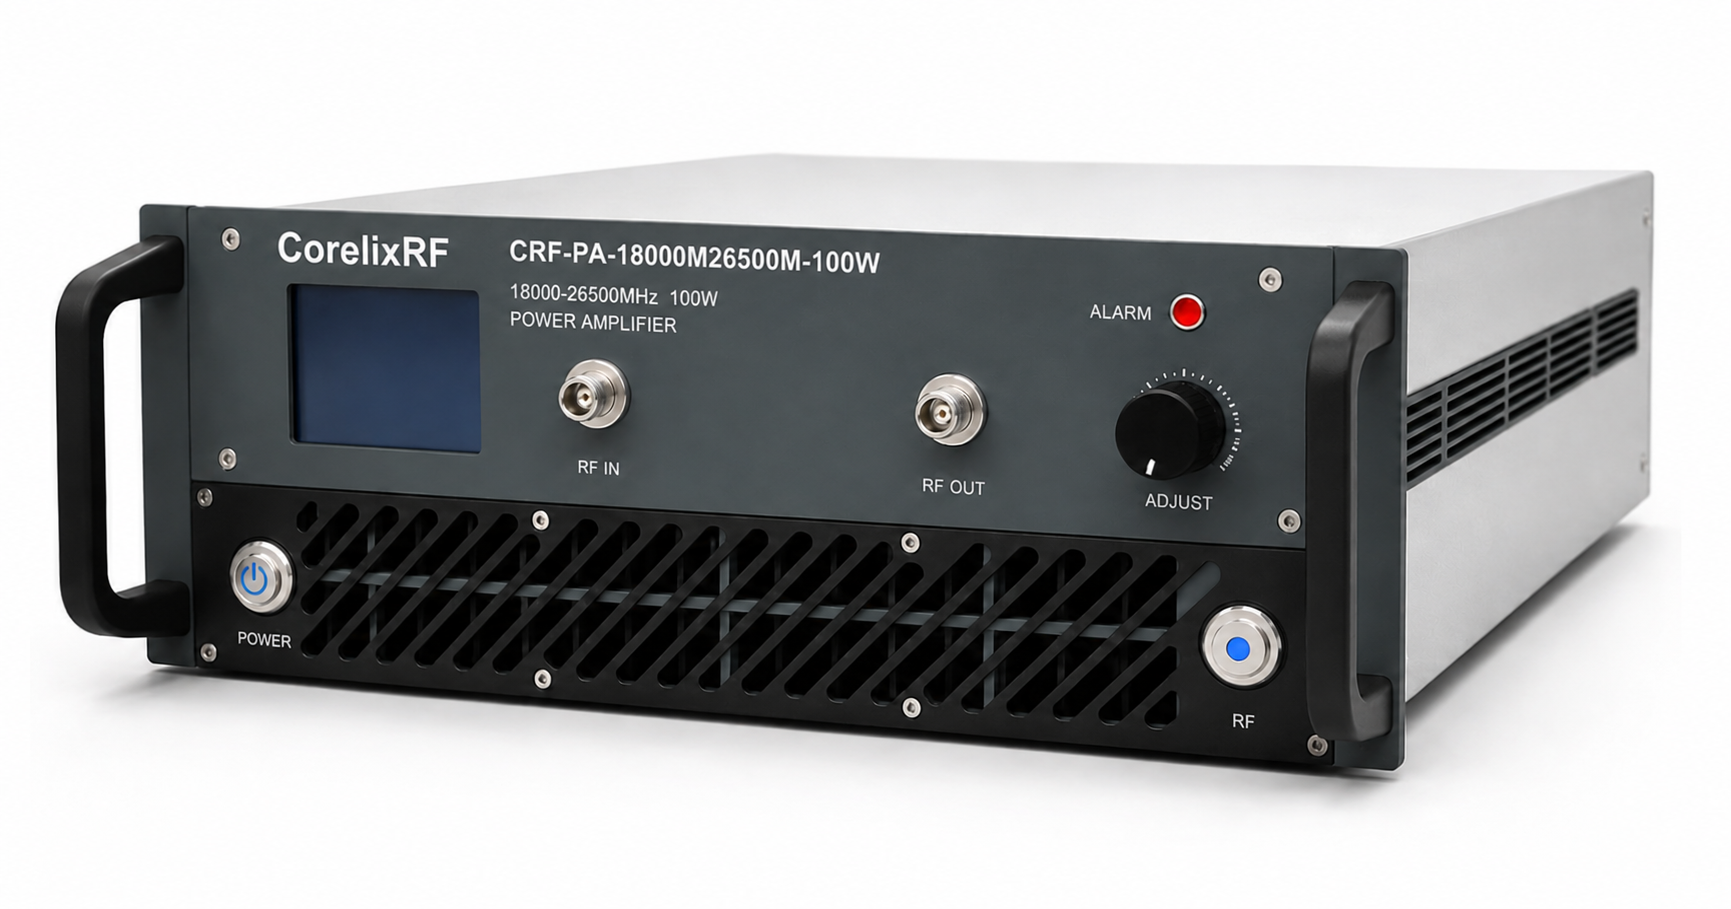
- Acceptance Criteria: The curve must remain flat across the entire nominal frequency band, with no steep drop-offs at the low or high-frequency edges. For example, when accepting a broadband GaN device like the CRF-PA-18000M26500M-100W, it must be confirmed that at the 18GHz and 26.5GHz boundaries, the output power still strictly meets the 100W baseline requirement.
2. Gain Flatness: What are the consequences of excessive gain curve fluctuations?
- Engineering Mechanism: Gain ripple directly causes AM-AM distortion in complex modulated signals (like QAM, OFDM), degrading the system’s Error Vector Magnitude (EVM).
- Which Curve to Review: Review the small-signal gain (S21) curve.
- Acceptance Criteria: For high-precision systems, in-band gain fluctuations should be controlled within a specified ±dB range, and there should be no sharp resonance peaks.
3. P1dB and Psat: Why do system linearity tests always fail?
- Engineering Mechanism: Many manufacturers prefer to use saturated output power (Psat) as their primary selling point. However, for non-constant envelope communication systems, the true determinant of linearity margin is the 1dB compression point (P1dB). Once the amplifier enters the deep compression region, intermodulation distortion deteriorates exponentially.
- Which Curve to Review: Review the AM-AM power sweep curve (Pin vs. Pout).
- Acceptance Criteria: The report must clearly mark the position of P1dB. The QA department should verify whether the Peak-to-Average Power Ratio (PAPR) back-off required by the project falls safely within the linear region of P1dB.
4. Harmonic Testing: How do harmonics interfere with or damage the system chain?
- Engineering Mechanism: The non-linear transistor characteristics of solid-state amplifiers generate harmonics at integer multiples of the fundamental frequency (primarily second and third harmonics). Unfiltered high harmonics not only waste DC power but can also burn out subsequent frequency-sensitive narrowband components.
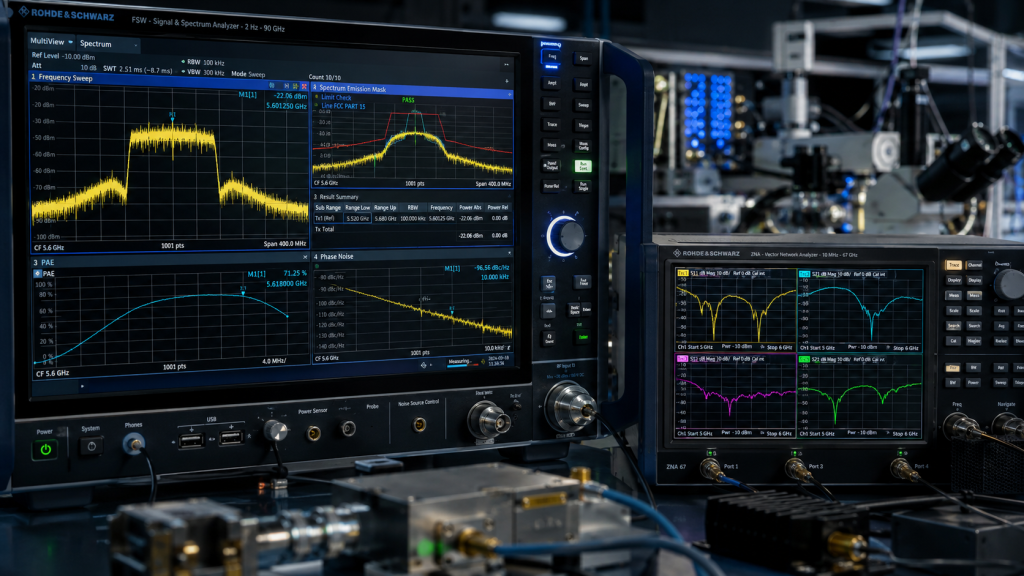
- Which Curve to Review: Review the harmonic spectrum plot (dBc) captured by a spectrum analyzer.
- Acceptance Criteria: Testing must be conducted at the maximum rated output power. The second and third harmonic suppression metrics (typically required to be less than -15dBc or -20dBc, depending on application requirements) must strictly meet the standard in actual testing.
5. Spurious Emissions: What causes the noise floor to rise abnormally with no signal input or in the compression region?
- Engineering Mechanism: Poor bias circuit design, inadequate grounding, or power supply ripple coupling can cause the amplifier to self-oscillate at specific frequencies or generate input-independent spurious signals, directly masking the weak echoes of radar or EW systems.
- Which Curve to Review: Review the broadband Spurious Emissions sweep plot.
- Acceptance Criteria: Whether in a small-signal or deep saturation state, spurious levels must remain below -60dBc (or the project’s specific requirements) to ensure spectrum purity.
6. Temperature Rise and Gain Drift: Why does power drop completely after 1 hour of full-load operation?
- Engineering Mechanism: The junction temperature of high-power RF devices directly affects electron mobility. Poor thermal design leads to high thermal resistance; for every 10°C increase in temperature, the device’s gain and output power will experience a significant negative gain drift.
- Which Curve to Review: Review the power/gain vs. time curve in high-temperature environments (actual data from high/low-temperature environmental chambers).
- Acceptance Criteria: The amplifier must output full power continuously at the maximum operating ambient temperature (e.g., +55°C or +65°C). Record the power drop amplitude after thermal equilibrium to ensure thermal degradation remains within the system’s tolerance.
7. VSWR Tolerance: Will antenna-side reflection directly burn out the amplifier?
- Engineering Mechanism: When the RF output encounters an impedance mismatch (such as a damaged or misconnected antenna), RF energy reflects back into the final-stage die of the amplifier, superimposing with the forward voltage. This makes it extremely easy to break down GaN or GaAs dies.
- Which Curve to Review: Review the VSWR protection test records under high mismatch conditions.
- Acceptance Criteria: The test report should demonstrate whether the internal alarm protection circuit can rapidly cut off the RF input or reduce the bias when facing a 3:1 or even infinite VSWR (open/short circuit), ensuring the equipment escapes damage.
8. Power Added Efficiency (PAE): Why is the chassis cooling system always overloaded?
- Engineering Mechanism: Inefficient amplifiers convert the vast majority of DC power into waste heat. Falsely labeled efficiency not only means power supply modules require re-selection but also places the entire system’s thermal management at risk of critical failure.
- Which Curve to Review: Review the PAE vs. Frequency or Output Power curve.
- Acceptance Criteria: At the rated output power, review not only the efficiency at the center frequency but, more importantly, the measured efficiency data at the worst-case point across the entire operating band (usually the highest frequency point).
9. Phase Noise: Will the amplifier itself degrade the system’s phase noise metrics?
- Engineering Mechanism: Although the amplifier is primarily responsible for amplifying signals, poor-quality amplifiers significantly elevate the signal’s noise floor due to AM-PM conversion effects and additive noise introduced by the power supply, severely impacting the velocity resolution of Doppler radars.
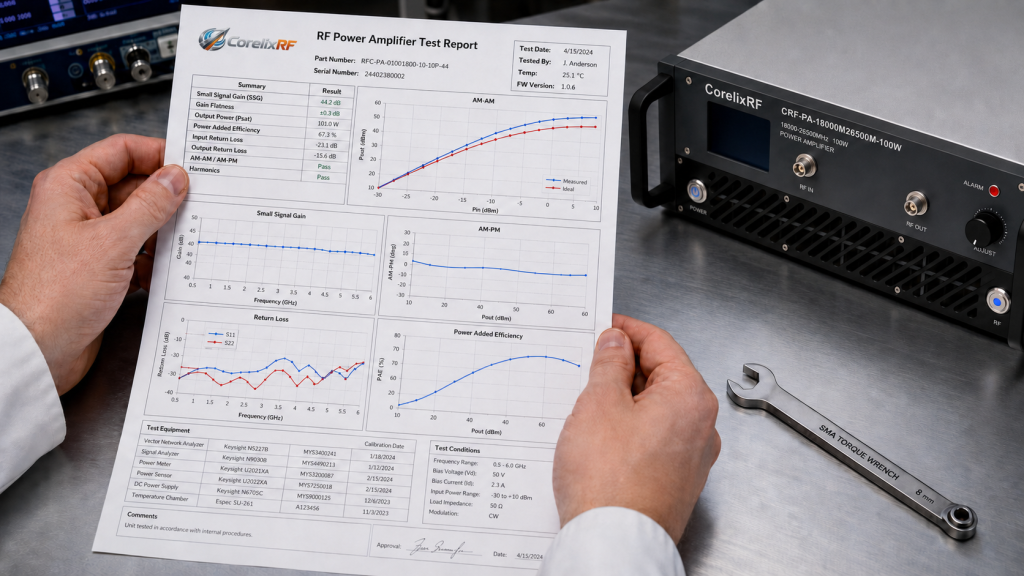
- Which Curve to Review: Review the measured Residual Phase Noise chart.
- Acceptance Criteria: For phase-noise-sensitive systems, an additive phase noise curve from 10Hz to 1MHz offset frequencies must be provided to prove the amplifier does not significantly degrade the system’s excitation source.
10. Burn-in Records: How to avoid equipment being returned for repair after three months of field operation?
- Engineering Mechanism: The failure rate of RF semiconductor devices follows a “bathtub curve.” Early “infant mortality” is often caused by soldering defects, micro-cracks, or process flaws. Products lacking strict burn-in testing have extremely high after-sales return rates.
- Which Curve to Review: Review the full-power Burn-in Test data log prior to factory dispatch.
- Acceptance Criteria: The report should include at least a 48 to 72-hour full-load operation log, actively monitoring and recording that the operating current, temperature, and output power exhibit no abnormal jumps during this period.
From Standard Parameters to Engineering Reality: Submit an RFQ to Initiate an Engineering Review
Procurement and QA teams auditing RF suppliers should not ignore the massive integration risks hidden behind technical details just to secure a seemingly cost-effective quote. In system integration projects, no issue is more destructive than discovering fraudulent baseline hardware metrics during the acceptance phase.
CorelixRF consistently adheres to an engineering data-driven manufacturing philosophy. Whether producing standardized test instrument amplifiers or fulfilling customized projects for radar and electronic countermeasure systems, every single device that rolls off our line is equipped with a complete laboratory physical test report and burn-in record. We ensure that the hardware delivered to your hands is absolutely consistent with the datasheet, permanently eliminating any “blind box” risks.
For your upcoming system projects, if you need to define the exact engineering boundary conditions and acceptance specifications of your amplifier modules, please compile your frequency range, power requirements, waveform types, and mechanical constraints, and submit them to us for an Engineering Review.
Want to know what detailed data a truly rigorous RF amplifier factory test report should contain?
👉 [Request a Sample Test Report] to acquire the standard FAT acceptance document package directly from the CorelixRF laboratory.
Use test curves as purchasing evidence
A useful RF amplifier test report should show the buyer where the unit passes or fails: gain flatness, output power, harmonics, spurious, thermal drift, VSWR response and control alarms. Send the required curve list before ordering.
Recommended next step: send the operating band, required output power, duty cycle, load condition, control interface, cooling limit, protection behavior and required FAT documents. CorelixRF can map this RF power amplifier test report curves requirement to a standard platform, a controlled modification or a custom RF build.