
The 1 dB compression point is the input or output power where an RF amplifier’s gain falls 1 dB below its small-signal value. To use that result, you need more than a power figure. You also need the test frequency, port reference planes, signal type, and operating conditions.
Two amps may carry the same output rating but reach compression at different levels. For a buyer, the task is to compare data on the same basis. For a test engineer, it is to check that the gain drop comes from the amp, not the test chain.
This guide covers a single-tone power sweep from setup through reporting. It also uses a CorelixRF datasheet to show how to read typical values and define project acceptance needs.
1. What Does the 1 dB Compression Point Mean?
At low drive, gain is close to constant. A 1 dB rise in input power gives close to a 1 dB rise in fundamental output power. As drive rises further, the output may fall below that linear trend.
Let Gref be the small-signal reference gain in dB. Use dBm for input power Pin and fundamental output power Pout:
Linear reference output = Pin + Gref
Compression C = Gref − (Pout − Pin)
The 1 dB compression point occurs when C reaches 1 dB. IP1dB is the input power at that point. OP1dB is the output power from the same test. With the same conditions and port reference planes:
OP1dB = IP1dB + Gref − 1 dB
The final term accounts for the lost gain. If you leave it out, you place output P1dB 1 dB too high. Also keep dBm power values apart from dB gain values. Convert a watt value to dBm before using it in these sums.
How does P1dB differ from saturated power?
P1dB and saturated output power, or Psat, refer to different states. Their gap is not fixed across all amps. A product label such as “100 W” cannot tell you either value unless the datasheet defines that rating.
At P1dB, gain has already dropped. Whether the resulting distortion is acceptable depends on the signal and system limits. Set those limits apart from the gain-compression target and the maximum allowed input power.
2. Which Conditions Define a 1 dB Compression Point Test?
Write down the test conditions before you choose a drive range. A change in frequency, temperature, or gain setting may change the result. Keep those conditions with the power value so another team can repeat the test.
| Condition | What to record |
|---|---|
| Frequency | Test points and the band they must cover |
| Operating state | Supply, bias or gain settings, and active mode |
| Signal | Single-tone CW, or pulse width, repeat rate, duty cycle, and measurement window |
| Reference planes | The ports or points where you report input and output power |
| Thermal state | Ambient or baseplate temperature, cooling, warm-up, and the rule for a stable reading |
| Load and limits | Load, allowed drive range, component ratings, and when to stop |
With a pulse signal, state whether power refers to the pulse-on interval or the full-period average. A CW test does not prove performance under every pulse condition. Use a separate, defined method for CW and pulsed operation.
Let the unit reach the thermal conditions defined in your cooling plan. Record the temperature and its location, such as a named point on the baseplate. “Warm” does not tell another engineer enough. Use the same settling rule and gain reference when you compare units.
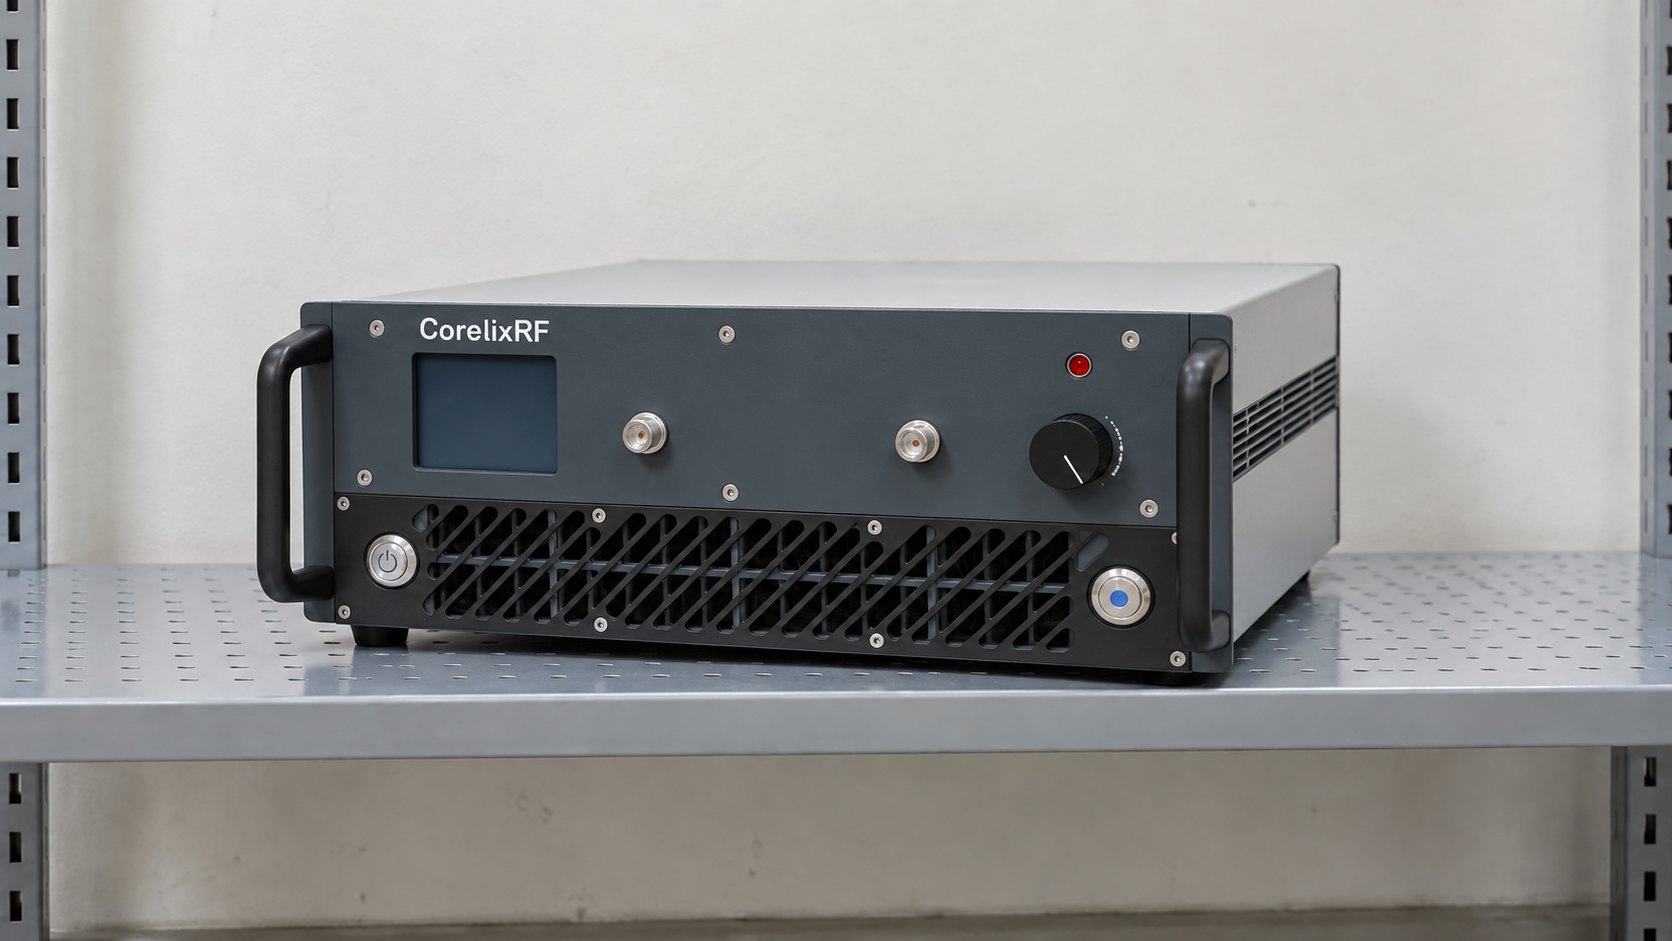
Before you apply RF, check the allowed input drive and startup conditions. An expected compression point does not permit excess drive. If you reach the input limit before 1 dB compression, stop there and report the tested range.
3. How Do You Set Up a 1 dB Compression Point Test?
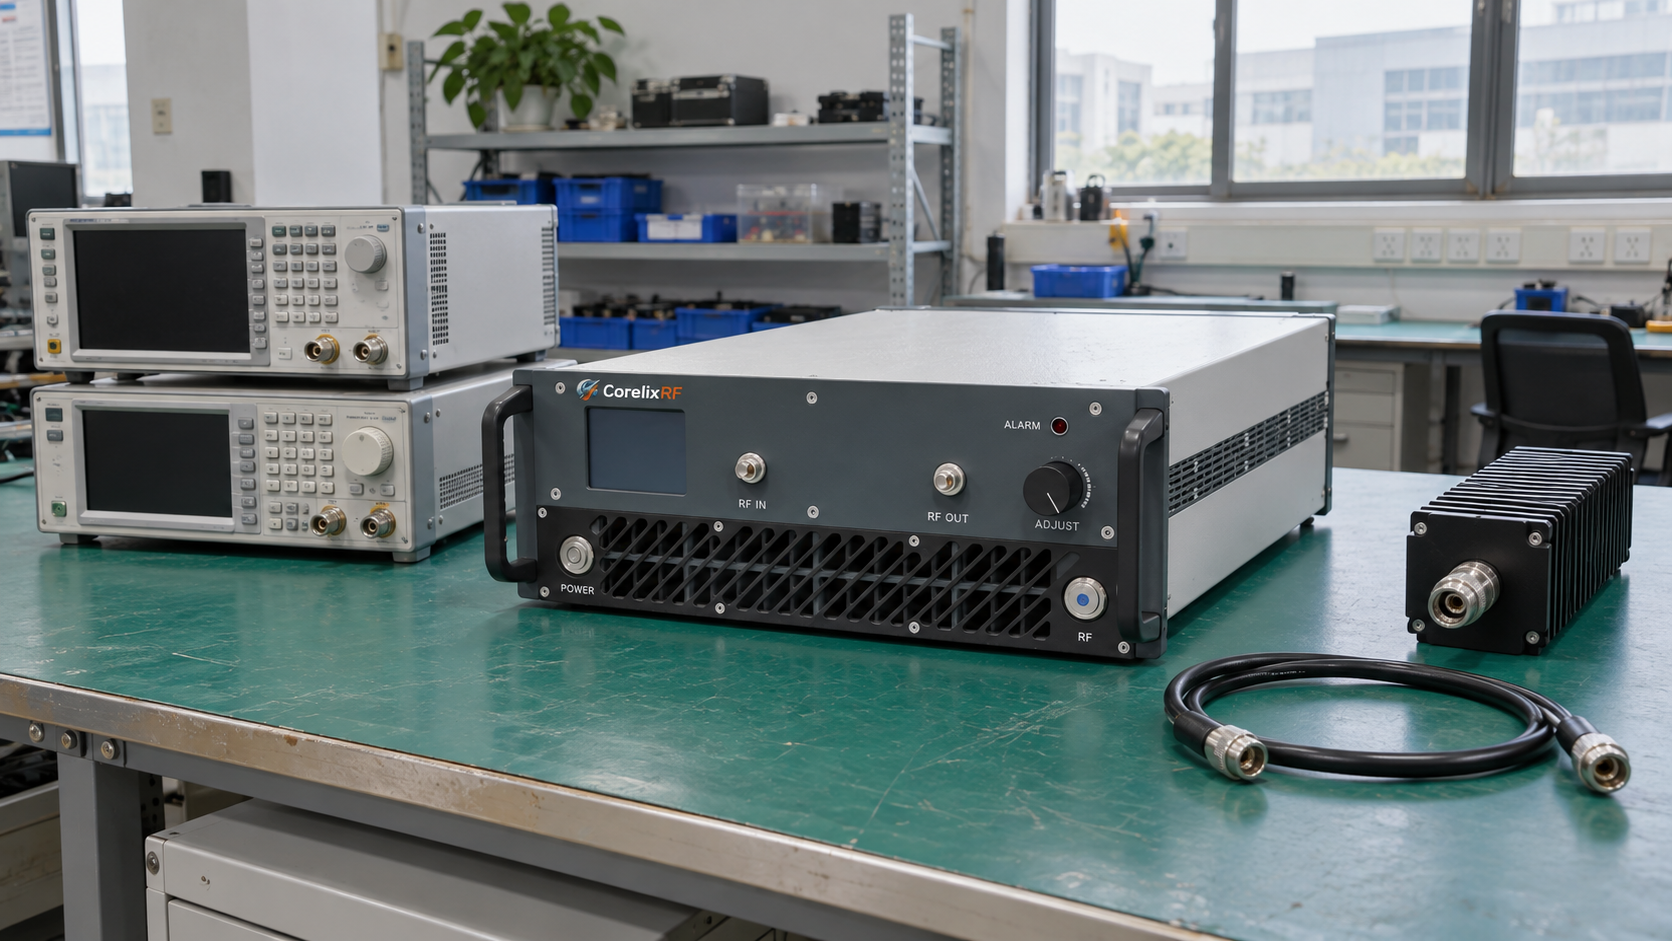
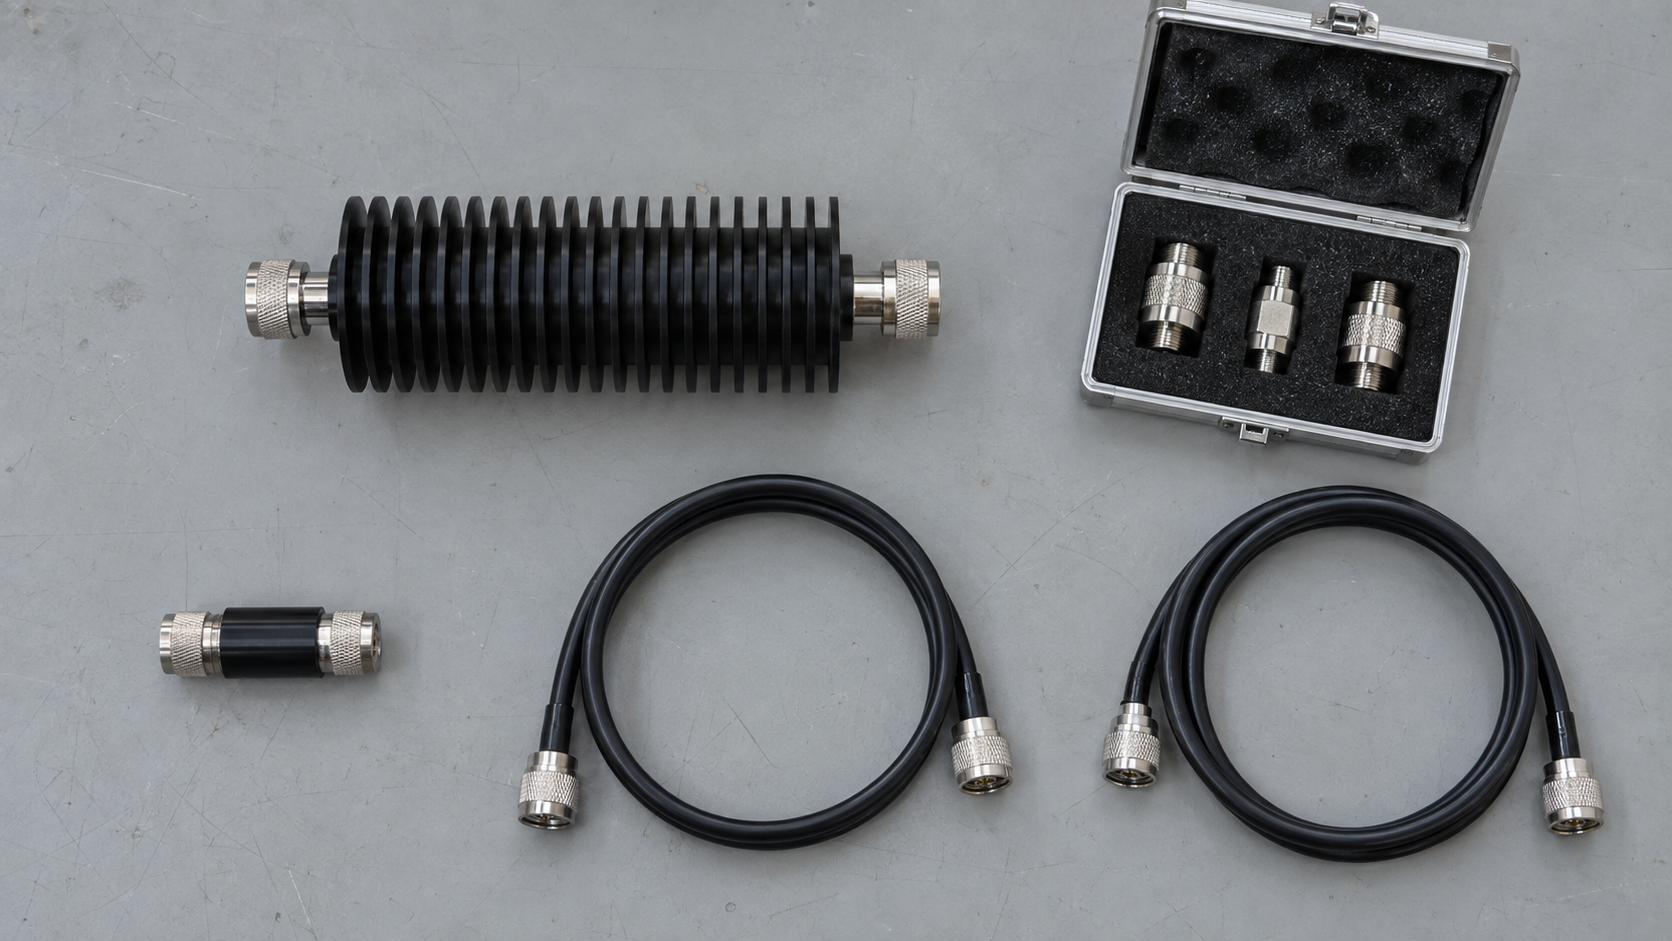
Use a controlled RF source, the amp under test, a rated load, and a calibrated output path. A coupler can sample the output while its main line feeds the load. A rated attenuator chain may also suit the task, if it can handle the power and give useful readings.
Measure the power that reaches the amp input. A source setting may differ from that value due to cable loss, drift, or driver compression. If you use a driver, check the full input path over the planned drive range.
Set the receiver range before the sweep
Work out the highest power at each part of the chain. Check load and attenuator heat dissipation, both coupler port ratings, and the receiver limit. The receiver must stay within its linear range as well as below its damage limit.
Too much attenuation puts low-level readings near the noise floor. Too little can make the receiver compress before the amp does. Both can distort the gain curve. Choose a range that gives valid readings at each test point.
Correct power to the amp ports
Check the loss of cables, adapters, couplers, attenuators, and filters at each test frequency. Then apply the matching correction. Check whether the test software has already done this; adding a correction twice gives the wrong result.
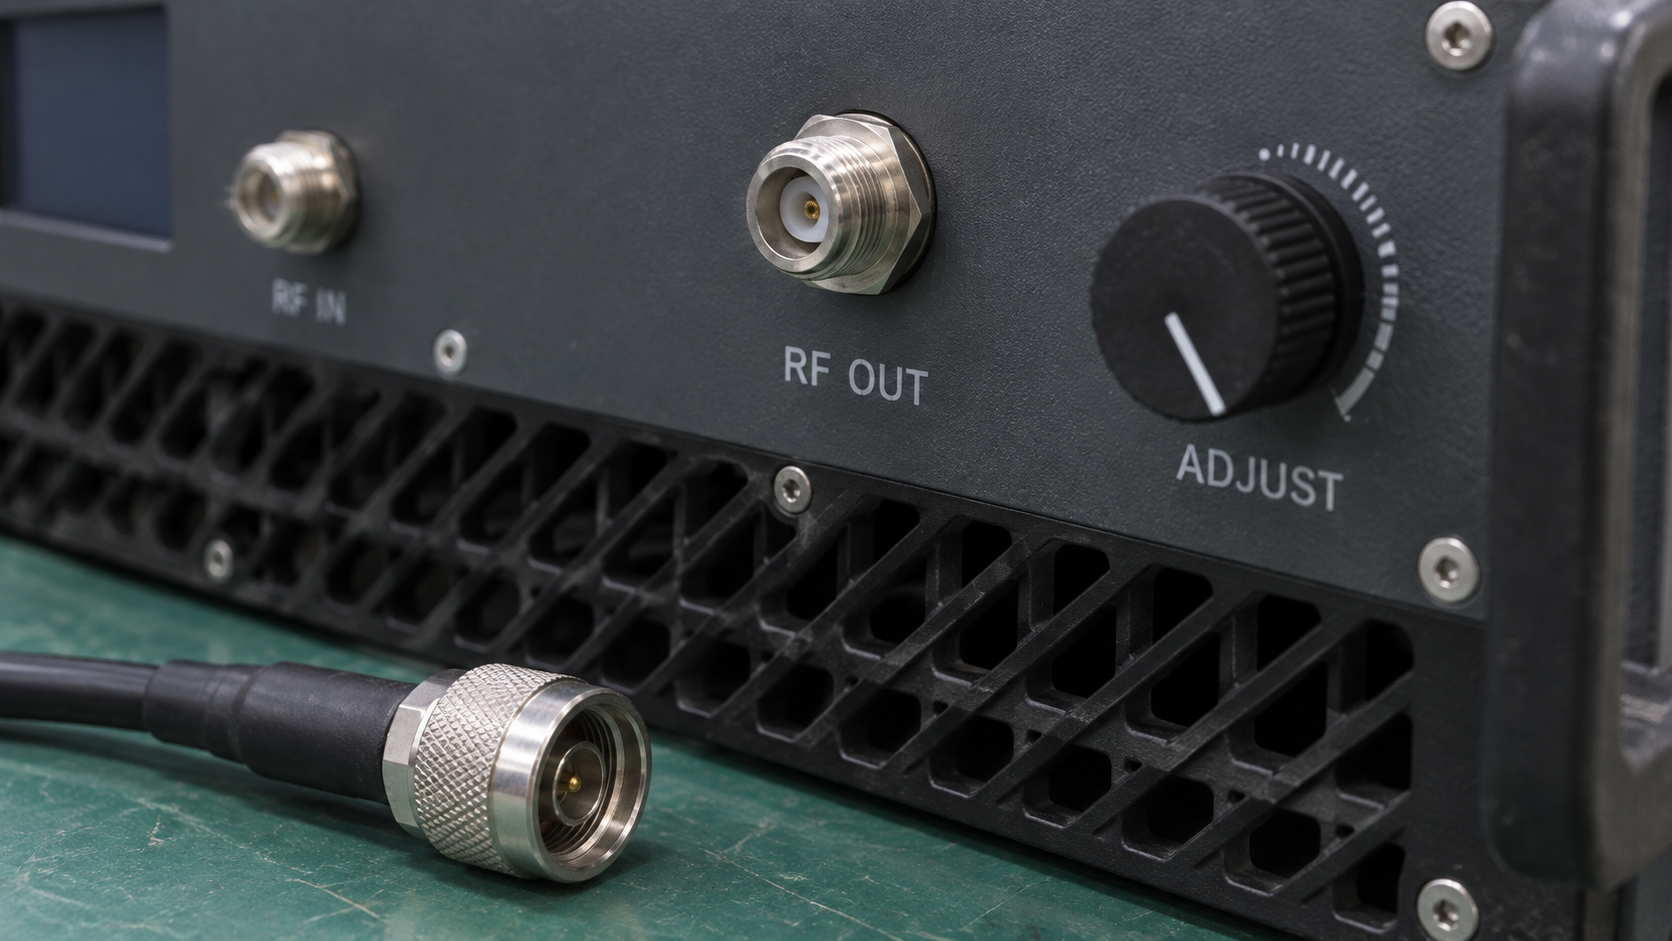
For a direct path from amp output to receiver, let Lout be its positive loss in dB:
Power at the amp output = receiver reading + Lout
A coupled path needs the full calibrated transfer from the output reference plane to the receiver. That includes coupling and path loss. Scalar loss correction does not remove all mismatch effects. Include the remaining mismatch and power-calibration uncertainty in your report.
Measure the fundamental power
Use power at the driven frequency to assess gain compression. A broadband power sensor may also collect harmonics. As drive rises, those extra signals can change its reading and obscure the drop in fundamental gain.
Use a suitable frequency-selective receiver, or a characterized filter with a power sensor when needed. Include filter loss and its effect on the path. With a VNA measurement setup, check gain calibration and absolute-power calibration separately. A valid gain reading alone does not prove every power reading is correct.
4. How Does a Sweep Locate the 1 dB Compression Point?
Start at one test frequency. Choose low drive where gain is linear and both power readings are clear. Keep the supply, gain setting, load, and heat state fixed during the sweep.
- Find Gref. Take several low-drive readings. Check that gain stays close to constant. Record the points used for the reference.
- Raise drive in steps. Wait for the set settling time. Then log corrected input and fundamental output power.
- Find the gain drop. Subtract each measured gain from Gref. Keep the same reference for the whole sweep.
- Use smaller steps near the crossing. Add points around 1 dB compression without exceeding any limit.
- Repeat key points. Check whether sweep direction, settling time, or a fresh warm-up changes the result.
The table below uses made-up numbers to show the sums. These are not CorelixRF measurements or drive settings for a specific model. The small-signal reference gain is 30.00 dB.
| Input power, dBm | Fundamental output, dBm | Gain, dB | Compression, dB |
|---|---|---|---|
| −20.00 | 10.00 | 30.00 | 0.00 |
| −10.00 | 20.00 | 30.00 | 0.00 |
| −5.00 | 24.90 | 29.90 | 0.10 |
| 0.00 | 29.70 | 29.70 | 0.30 |
| 1.00 | 30.55 | 29.55 | 0.45 |
| 2.00 | 31.30 | 29.30 | 0.70 |
| 3.00 | 32.00 | 29.00 | 1.00 |
| 4.00 | 32.65 | 28.65 | 1.35 |
Here, IP1dB is 3.00 dBm and OP1dB is 32.00 dBm. At the same input, the linear reference gives 33.00 dBm. The example output is 1.00 dB lower, so this is the 1 dB compression point of the example.
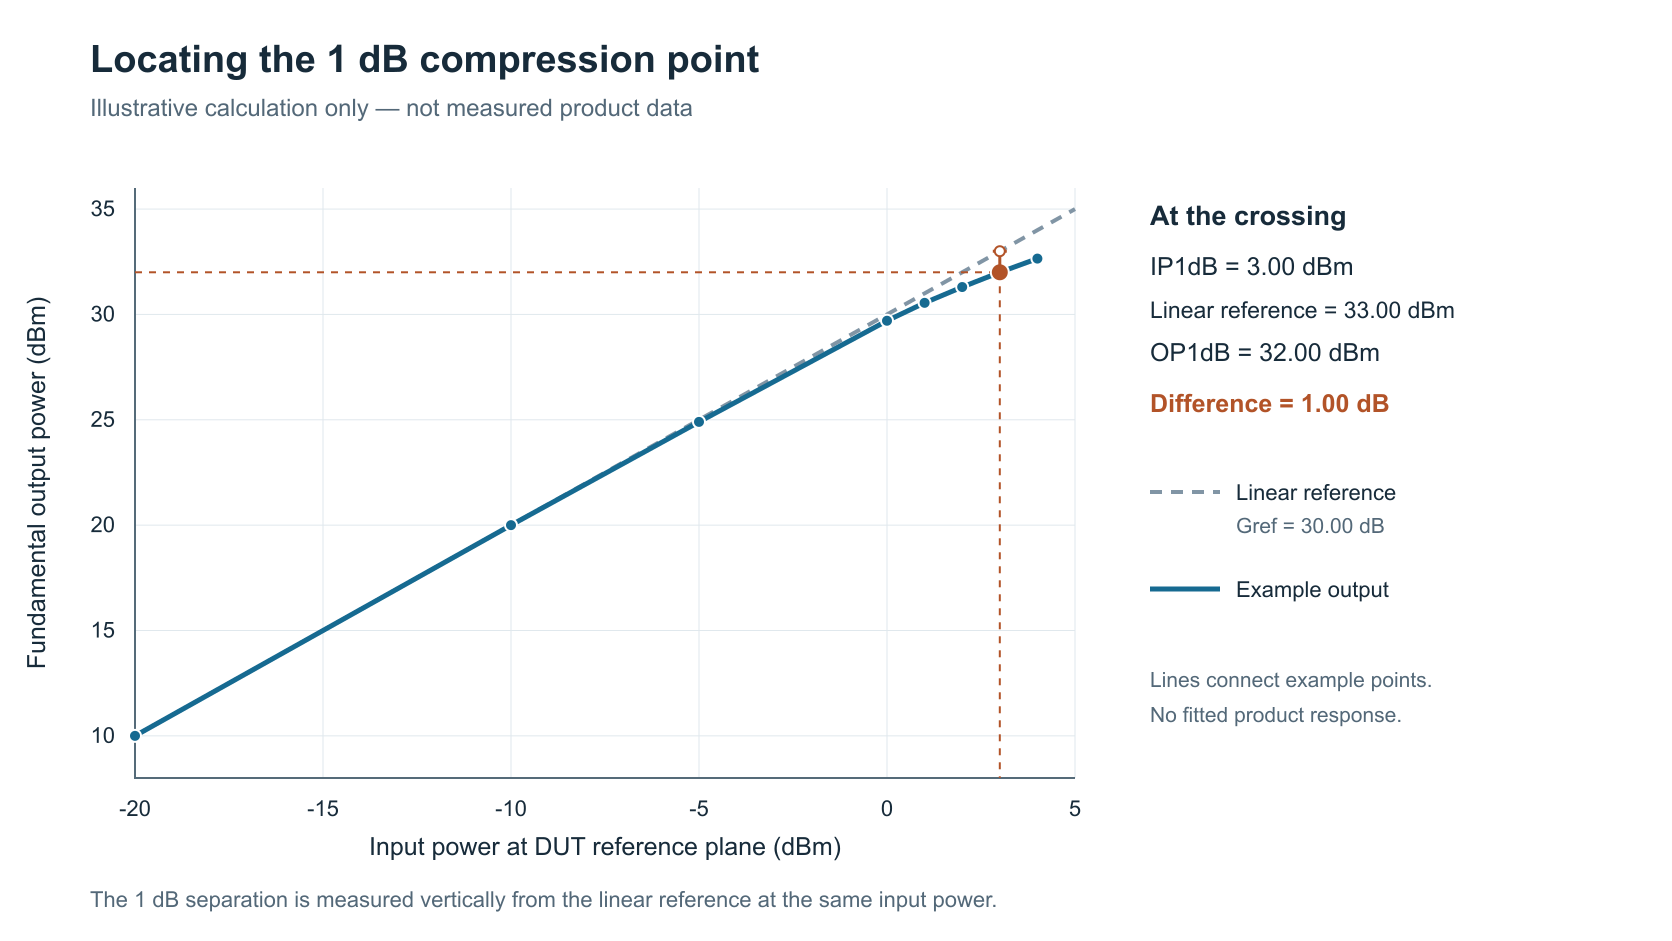
What if the 1 dB compression point falls between readings?
Real points may lie on either side of 1 dB compression. For a smooth curve with nearby points, you can estimate the crossing by interpolation. State that method in the report. Two decimal places in a result do not prove that level of accuracy; match the stated precision to the test uncertainty.
Repeat the sweep at the required frequencies. If the gain drop never reaches 1 dB at the maximum allowed drive, report that fact. Include the highest tested powers. Do not extend the curve beyond the data and call the inferred crossing a verified result.
5. How Can You Separate Amp Compression from Test Errors?
A gain drop can come from more than one part of the setup. Log actual input power and output power together. Supply, temperature, and status records can help you trace the cause of a change.
| What you see | Possible cause | What to check |
|---|---|---|
| P1dB changes when receiver attenuation changes | Receiver compression or a wrong correction | Compare corrected results with calibrated attenuation and valid receiver levels |
| Source setting rises but actual amp input does not | Source or driver limit | Measure actual power at the input reference plane |
| Upward and downward sweeps differ | Heat, settling, or a change in state | Stabilize the setup, repeat the sweep, and log conditions |
| Gain, current, or status changes abruptly | Supply limit or a protection/control event | Check the supply at the unit and find the cause before proceeding |
| Broadband and selective readings differ | Harmonics or different paths | Compare fundamental power through corrected, comparable paths |
Changing attenuation can help diagnose a suspect 1 dB compression point. However, the new setup also changes the noise floor and may change mismatch. Use a defined configuration for the accepted result and keep its settings with the data.
If low-drive gain will not settle, fix that problem before you calculate compression. Keep an unexpected curve and its test conditions. Do not shift the reference to get the value you hoped to see. For a more complex response, state how you chose Gref.
6. How Should Buyers Compare 1 dB Compression Point Data?
Put each number beside its definition. IP1dB and OP1dB refer to different ports. A typical value and a minimum limit also mean different things in a purchase. A typical value by itself is not a minimum acceptance limit.
The CorelixRF CRF-PA-9K400M-100W datasheet shows why these distinctions matter. Its electrical table lists:
| Datasheet item | Minimum | Typical | Maximum | Unit |
|---|---|---|---|---|
| Frequency range | 9 kHz | — | 400 MHz | As shown |
| Output power | 100 | 150 | — | W |
| P1dB | Not stated | 80 | Not stated | W |
| Small-signal gain | 50 | Not stated | Not stated | dB |
The 80 W P1dB entry is in the typical column. The table does not promise a minimum P1dB of 80 W. Nor can you rename the separate output-power row as P1dB or Psat without a stated basis.

The document gives general conditions: a 50 Ω system, rated AC input supply, and standard production test configuration, unless noted otherwise. These do not give a P1dB curve at each frequency or prove performance over a full temperature range. Ask for the data your use needs.
Keep related values on the same basis
Do not combine minimum gain and typical P1dB to claim a guaranteed input compression point. Actual gain varies with frequency and operating state. Values used together must describe the same conditions.
To compare offers, match the port convention, units, test points, signal, heat state, and guarantee basis. List missing conditions beside the RF amplifier specification you are comparing. A defined result and an unexplained rating do not support the same decision.
7. What P1dB Evidence Should You Request Before Selection?
State what the data must help you decide. For a given band, ask for a 1 dB compression point test at the agreed frequencies and operating conditions. Also ask how the supplier found the lowest reported value.
The test package should support production test coverage and traceability. Include:
- Model, configuration, document revision, and whether data cover a sample, one named unit, or a defined group.
- Corrected input/output sweeps, reference gain, extracted IP1dB and OP1dB, and the method used to find them.
- Test frequencies, waveform, supply and gain settings, load, cooling, and heat conditions.
- Reference planes, path corrections, calibration status, and measurement uncertainty.
- Agreed limits, pass/fail rules, and how to handle a result near a limit or a sweep that never reaches compression.
If acceptance depends on a minimum P1dB, agree on the limit and its scope before you order. One sample curve cannot prove an unstated guarantee for all units under all conditions.
For a modulated signal, test the actual waveform at the planned output. Check EVM, ACLR, or other limits that apply. A CW 1 dB compression point does not give a universal backoff value. The relationship between EVM and output power needs its own controlled test.
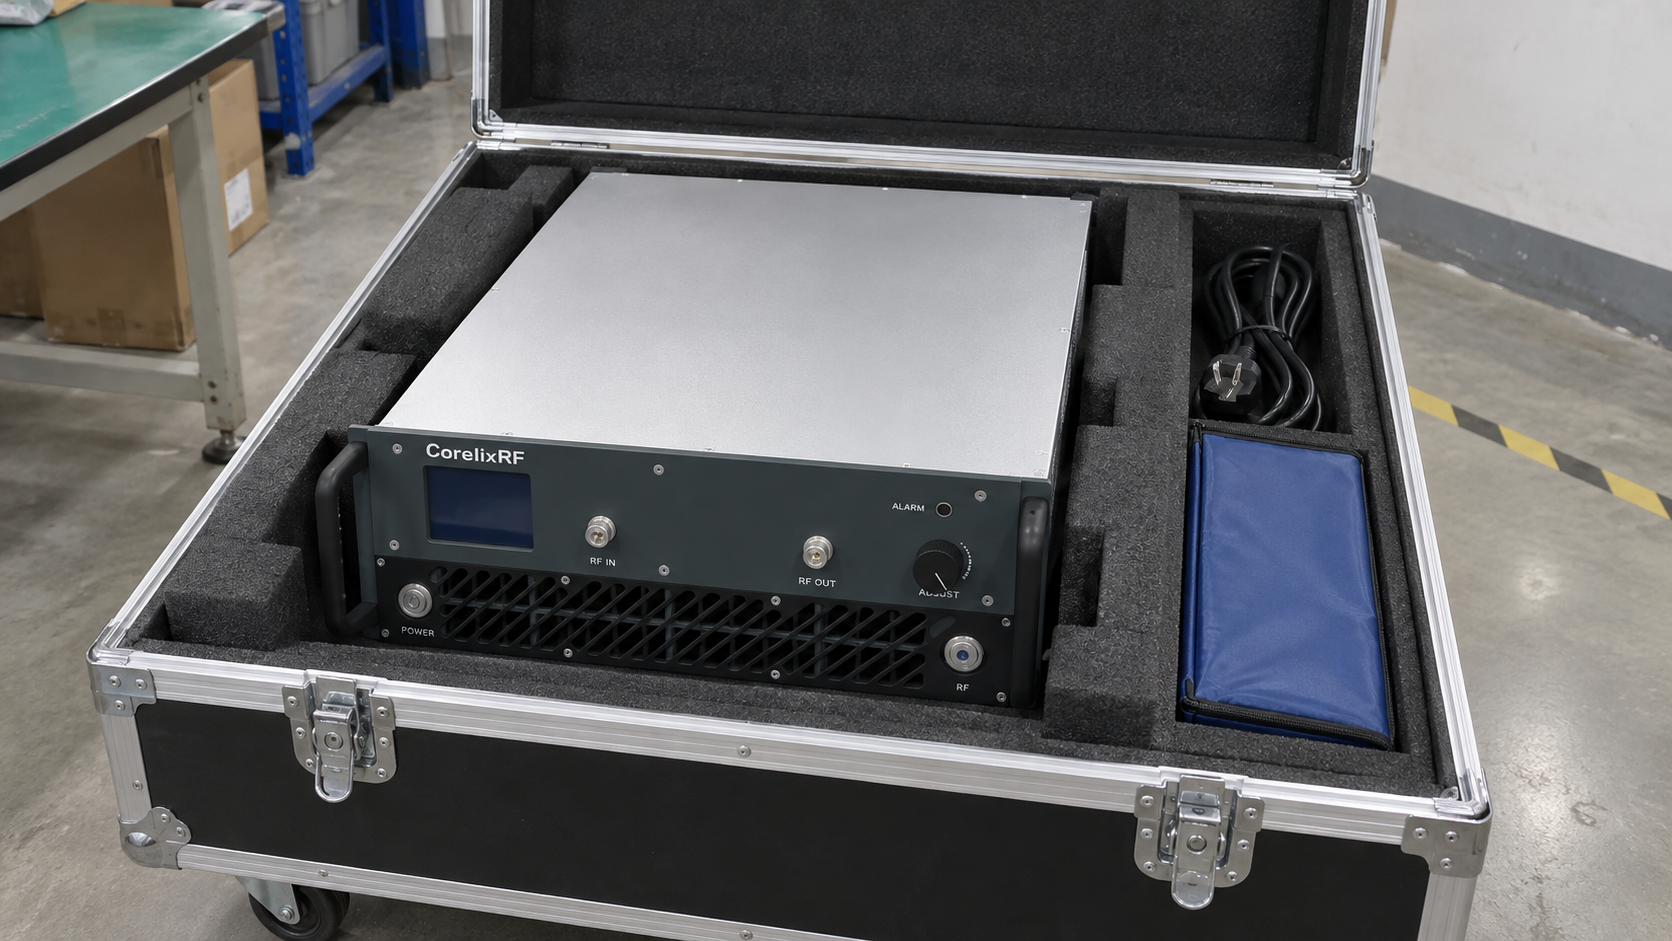
When you shortlist CorelixRF power amplifiers, state the output you need for your signal and cooling conditions. Separate published typical values from project acceptance limits. Send your frequency range, waveform, target power, cooling constraints, and required test data to our engineering team for a configuration review.
Frequently Asked Questions
Q1: Is P1dB the Same as Saturated Output Power?
No. P1dB marks a gain drop of 1 dB from the small-signal reference. Saturated power describes another part of the response. Their gap depends on the amp and test conditions, so use defined data instead of a fixed conversion.
Q2: How Do Input P1dB and Output P1dB Differ?
They are the input and output powers at the same 1 dB compression point. With power in dBm and gain in dB, OP1dB = IP1dB + Gref − 1 dB. Use the same frequency, operating state, and port reference planes for both.
Q3: Can P1dB Be Calculated from Rated Output Power Alone?
No. Rated output needs its own definition and test conditions. Without a compression rating or valid sweep data, it cannot establish P1dB. Gain and rated output alone are not enough.
Q4: Does Operating Below P1dB Guarantee Acceptable EVM?
No. Waveform, noise, phase distortion, memory effects, and test conditions also affect EVM. Test the target signal at the planned output. Do not use CW P1dB as an EVM pass limit.
Q5: What Should Be Reported If the Test Never Reaches 1 dB Compression?
Report “1 dB compression not reached within the tested range.” Give the highest tested input/output powers, gain drop, conditions, and reason for stopping. Any lower-bound claim must account for uncertainty and apply only to those test conditions.